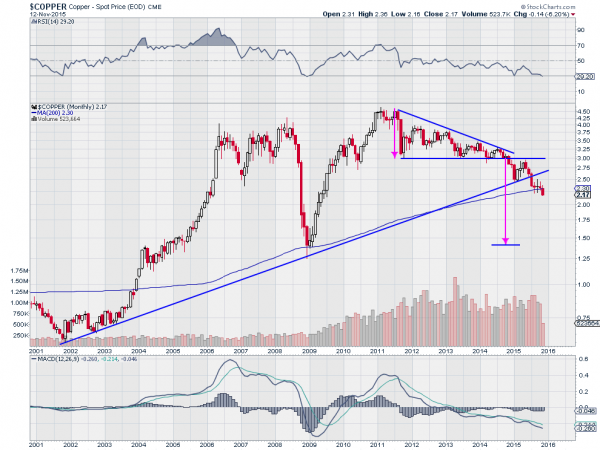
Back when they were just residents this time last year, the group of doctors above began their careers with a diagnosis. New to the field and without the bias of many years of experience these young residents took a look at the chart for copper and made a diagnosis.
At the time the commodity was bouncing off of a 13-year long trend support line. Their read was that copper could very well be turning around from that perspective. But the rest of the chart pointed lower so caution was advised. They noted the potential to retest the breakdown level and at that point create a stronger downtrend. One year later that diagnosis is holding up.

The chart above shows copper not only rejected lower at the retest of the $3 level. But it then broke down through the 13 year trend support and continued. The recent activity takes it below the 200-month SMA as well and the prognosis for the future is not good. With momentum still in the bearish zone and falling in both the RSI and MACD, Copper has support for more downside. How far can it go? The target on the break of the descending triangle would suggest it could go as far as $1.40. Clearly Dr. Copper is in trouble.
The information in this blog post represents my own opinions and does not contain a recommendation for any particular security or investment. I or my affiliates may hold positions or other interests in securities mentioned in the Blog, please see my Disclaimer page for my full disclaimer.
