
D.R. Horton Inc. (NYSE:DHI) is scheduled to report first-quarter fiscal 2018 results on Jan 31, before the opening bell.
The homebuilder delivered in-line earnings last quarter. The company surpassed estimates in three of the last four quarters, the average beat being 5.01%.
Like other homebuilders, D.R. Horton is well poised to gain traction on the current positive housing scenario. Steady job and wage growth, a recovering economy, historically low interest/mortgage rates, rising rentals, rapidly increasing household formation and a limited supply of inventory, point at strong demand in 2017.
Resultantly, the company’s share price has increased more than 41% in the last six months, outperforming the industry’s 29.9% rally.
Let’s See How Things Are Shaping Up for Q1
Recently, D.R. Horton updated it guidance for fiscal 2018 tax rate. The company now expects it to be 26%. It will be taking approximately $115 million non-cash charge in Q1 due to a change in the Federal tax code. The company expects 25% tax rate for fiscal 2019.
Let’s take a look at the other metrics of the company, i.e. revenues, order growth and gross margin. D.R. Horton, one of the top builders in the United States, now expects its backlog conversion rate for the first quarter to be in the range of 83-86%. This compares favorably with the year-ago level of 82%.
The company’s homebuilding revenues increased 11.4% year over year in the preceding quarter. However, for the to-be-reported quarter, the Zacks Consensus Estimate for Homebuilding revenues (comprising about 98% of total revenues) of $3,189 million indicates a decrease from $4,067 million in the last quarter and $4,066.5 million in the year-ago period. This downside may be due to the weather issues.
Net sales orders increased 18% to 10,333 homes on continued improvement in the preceding quarter. For the upcoming release, the consensus estimate for net sales orders were 10,477 units compared with 9,241 units a year ago. Home closings is estimated to be 10,470 units compared with 13,165 units in the preceding quarter and 9,404 units a year-ago.
On the other hand, consensus estimate for Financial Services revenues of $85 million indicates a decrease from $93 million in the prior quarter and $92.6 million a year ago.
The Zacks Consensus Estimate for total revenues stands at $3.28 billion, implying 12.8% year-over-year growth.
Now, for the company’s gross margin, D.R. Horton expects home sales gross margin to be around 20%. In the year-ago quarter, it was 19.8% in the preceding quarter, the company’s gross margin on home sales contracted 10 basis points (bps) year over year to 20.3%. Rising labor costs are threatening margins of noted homebuilders like D.R. Horton, Lennar Corp. (NYSE:LEN) , KB Home (NYSE:KBH) , PulteGroup Inc. (NYSE:PHM) and Toll Brothers, Inc. (NYSE:TOL) among others.
For SG&A (selling, general and administrative) expenses, as a percentage of homebuilding revenues, the company expects it to be in the range of 9.5-9.8%. This compares with the year-ago level of 9.5%.
Nonetheless, D.R. Horton remains well poised to gain traction on the current positive housing scenario. Overall, for the fiscal first quarter, the Zacks Consensus Estimate for earnings is pegged at 63 cents per share, reflecting an increase of 14.6% year over year.
Here is what our quantitative model predicts.
D.R. Horton has the right combination of the two key ingredients — a positive Earnings ESP and a Zacks Rank #3 (Hold) or higher — for increasing the odds of an earnings beat. You can uncover the best stocks to buy or sell before they’re reported with our Earnings ESP Filter.
Zacks ESP: D.R. Horton has an Earnings ESP of +4.78%.
Zacks Rank: D.R. Horton carries a Zacks Rank #2 (Buy), which increases the predictive power of ESP.
Conversely, we caution against stocks with a Zacks Rank #4 or 5 (Sell rated) going into the earnings announcement, especially when the company is witnessing negative estimate revisions.
You can see the complete list of today’s Zacks #1 Rank (Strong Buy) stocks here.
D.R. Horton, Inc. Price and EPS Surprise
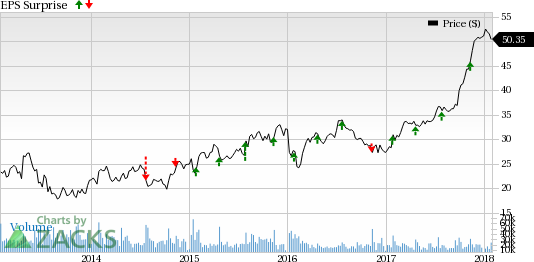
D.R. Horton, Inc. Price and EPS Surprise | D.R. Horton, Inc. Quote
Zacks Top 10 Stocks for 2018
In addition to the stocks discussed above, would you like to know about our 10 finest buy-and-hold tickers for the entirety of 2018?
Last year's 2017 Zacks Top 10 Stocks portfolio produced double-digit winners, including FMC Corp (NYSE:FMC). and VMware which racked up stellar gains of +67.9% and +61%. Now a brand-new portfolio has been handpicked from over 4,000 companies covered by the Zacks Rank. Don’t miss your chance to get in on these long-term buys.
Access Zacks Top 10 Stocks for 2018 today >>
PulteGroup, Inc. (PHM): Free Stock Analysis Report
Lennar Corporation (LEN): Free Stock Analysis Report
Toll Brothers Inc. (TOL): Free Stock Analysis Report
KB Home (KBH): Free Stock Analysis Report
D.R. Horton, Inc. (DHI): Free Stock Analysis Report
Original post
Zacks Investment Research