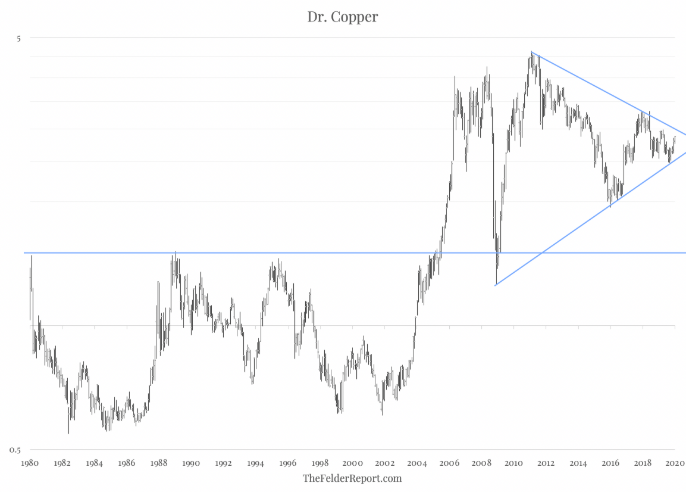
Traders call the metal “Dr. Copper” because he has a Ph.D in economics. In fact, most of the time, Dr. Copper forecasts recessions and recoveries, inflation and deflation, far more accurately than his colleagues in the “dismal science” so it pays to pay attention to his macroeconomic messages.
Over the past decade the metal has been consolidating above long-term support. Last year saw copper prices fell to test the uptrend line that constitutes the lower half of a long-term pennant pattern and then rebound. At this point, the coil is getting pretty tight. Now, copper prices appear poised to test the upper trend line.
Watch This Chart

A breakout above that line would suggest that inflation (even stagflation), after being written off as a relic of the past, could finally be making a comeback. Because asset prices have largely been boosted by a goldilocks period of decent growth and ultra-low inflation, this is a chart that most investors should keep a close eye on.
