Anxiety is a thin stream of fear trickling through the mind. If encouraged, it cuts a channel into which all other thoughts are drained. ~ Arthur Somers Roche
Once upon a time, in the good old days, before QE changed everything, any signs of strength from copper could be construed as a sign that the economy was on the mend. After QE, this story came to an end, and a new reality came into play. The Fed manipulated the markets in favour of short-term gains, a policy that has maintained an ultra-low interest rate environment that favours speculators and punishes savers.
In the past, the financial markets would have marched more or less to the same drumbeat as copper. The chart below illustrates that this no longer holds true. Instead of crashing with copper, the financial markets soared to new highs. 
One wonders, what will unfold when copper does finally put in a bottom? Will the financial markets rally in unison once again with Doctor Copper, or diverge as they have done for the past several years. Copper is issuing rather strong signs that a bottom could be close at hand.
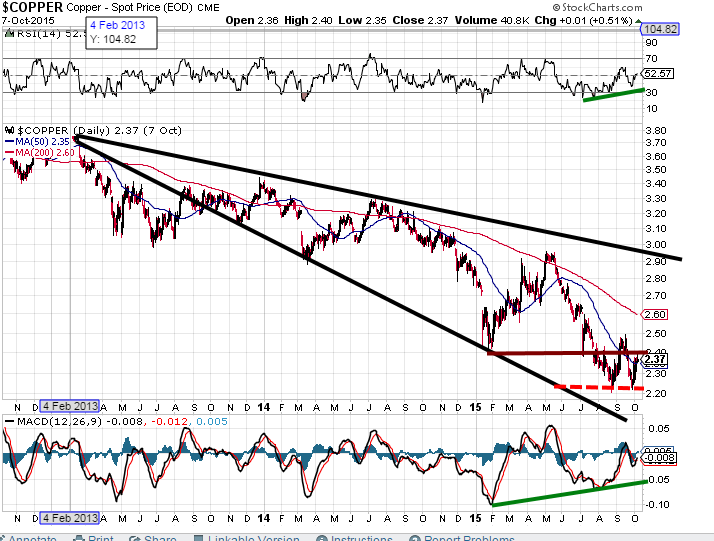
Our trend indicator has not turned bullish yet, but it is dangerously close to issuing a bullish signal. There are, however, several technical indicators flashing positive divergence signals, and this could be construed as a bullish development.
Technical outlook for Dr. Copper

Failure to hold above 2.40 will most likely result in a test of the 2.20 ranges. The ideal setup would be for copper to trade to new lows, and trigger a buy signal in the process.
Generally speaking, the elite players love to create the illusion that the market is ready to break out. This ploy is known as a head fake; a move set to fool regular market technicians and the masses into thinking a bottom is in place. If you take the time to look at long-term charts, you will see how splendidly this ruse has worked over the decades.
The market in question does initially rally, but then it breaks down. The early bulls panic and dump everything. This usually triggers a fast move to new lows and then the smart money rushes in and starts to buy, which then ushers in a more sustainable bottom.
Based on this premise, one could argue that this trick was employed in February of 2015. The markets rallied into May and then broke down again.
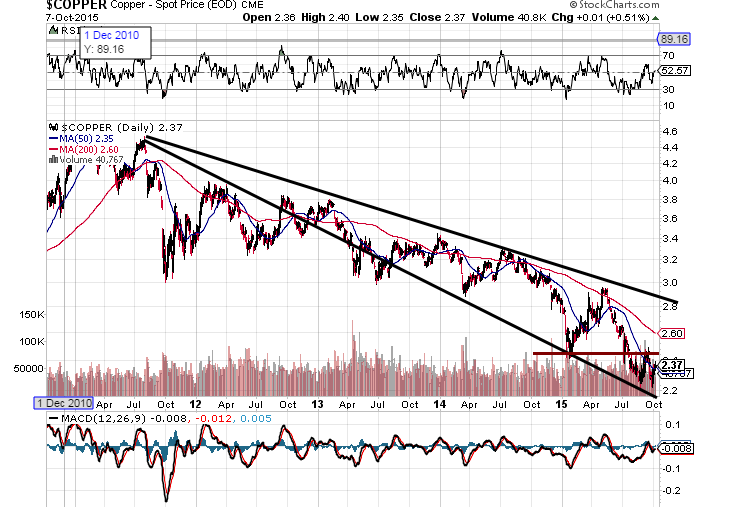
If you look at the above chart, you will notice that this has occurred before, so one cannot put faith on this factor alone. Other factors have to come into play as well, and it looks like those other factors could be coming into play now; we will mention them below.
Our goal has never been to predict the exact bottom in any market which is an endeavour we feel is best left to fools with an inordinate appetite for pain. We wait for the market to issue strong signals that a bottom is in or is close at hand. Sometimes this means getting in a bit early and sometimes it means getting in a bit later. The idea should be to catch the main move and not obsess about trying to get in at the exact bottom. A monthly close above 2.50 would be a strong signal that a bottom is in place and that copper is attempting to mount a strong rally.
Other factors that could be viewed as bullish developments:
- Copper prices are trading in the extremely oversold ranges; for the past decade copper has traded above 2.40. The only exception was the financial crisis of 2008.
- Freeport-McMoran (N:FCX) has stated it's going to suspend operations at several of its North American mines. It will suspend operations at its Miami mine In Arizona, reduce production by 50% at its Tyrone mine in New Mexico and adjust productions at other U.S. sites.
- Glencore PLC (L:GLEN), a major copper producer, shocked the markets by stating it would suspend production at two locations for 18 months. Two mines (the Katanga and the Mopani mines) are located in the Democratic Republic of Congo and Zambia. These two mines account for roughly 1.9%- 2% of the global output of copper.
- Chile's state-owned Codelco has gone on record stating that they will "cut costs to the bone". They have also delayed many expansion projects; Two notable expansion projects that have been delayed are at the Chuquicamata and Andina complex.
- Numerous key technical indicators are trading in extremely oversold ranges and many have triggered positive divergence signals which could be construed as a bullish development.
- The mantra out there for a while has been that China is in deep trouble. Thus, it must have come as a shock to many bearish analysts that China imported 350,000 metric tons of copper, up 4%, from the same period last year. This is something to pay attention to as it could be the beginning of a new trend. China accounts for roughly 45% of the total copper demand. Analysts are now offering diverging stories, with some reversing course and stating that there could be a copper deficit this year, while others continue to stick with their predictions that there will be an oversupply of copper until 2016. Regardless of the outcome, diverging opinions are a good sign as it indicates that the experts really know nothing. Knowing nothing is usually a signal that some sort of turnaround is in the works.
- Additionally, while Chinese imports of refined and semi-refined copper products were flat in August, its imports of concentrates surged approximately 20% from a year ago, and over 18% from the previous month. Could this be the beginning of a new trend?
So what's next for Dr. Copper?
A plethora of factors such as power outages, extremely bad weather, planned cuts by many of the largest mines in the world, strikes, etc., could potentially push this market into a deficit earlier than many experts assert. This would pave the way for price gains much earlier than expected. Experts are notorious for coming to the party late and leaving way too early. While the action in the copper markets looks promising, copper is still not out of the woods; a monthly close above 2.50 would serve as the first strong bullish confirmation that copper is getting ready to mount a sustainable rally. Our trend indicator has not turned bullish yet, but it is dangerously close to doing so. Once it turns bullish, we will start to look at this sector in a more aggressive manner.
Four copper stocks and ETFs to consider:
As the market is extremely oversold and there are signs of a potential reversal, it would make sense to look at some of the stronger plays in this sector. Southern Copper Corporation (N:SCCO) and FXC are examples of two decent plays in this sector. One could also go long via Global X Copper Miners ETF (N:COPX) and iPath DJ-UBS Copper (N:JJC). For disclosure purposes we would like to add that our subscribers are long FXC for an average entry price of 9.00. If the sector continues to show signs of strength, we will look to add to our position and deploy additional funds into new stocks in this sector.
History clearly illustrates that when an asset is cheap and sentiment is negative that the time to buy is close at hand. Mass psychology dictates that you should be wary when the masses are joyous and overjoyed when they are not. The crowd is decidedly negative and so an opportunity could be in the air.
Indecision is debilitating; it feeds upon itself; it is, one might almost say, habit-forming. Not only that, but it is contagious; it transmits itself to other. ~ H. A. Hopf
