Mohamed El-Erian noted that the US Dollar Index fell by 10% in 2017 and has already lost another 1.5% this year. This went against every macro thinker’s belief that it should rise. Rising interest rates in the US coupled with flat rates or falling and no significant discussion of a rise elsewhere should appreciate the dollar. Should is the key word in that sentence.
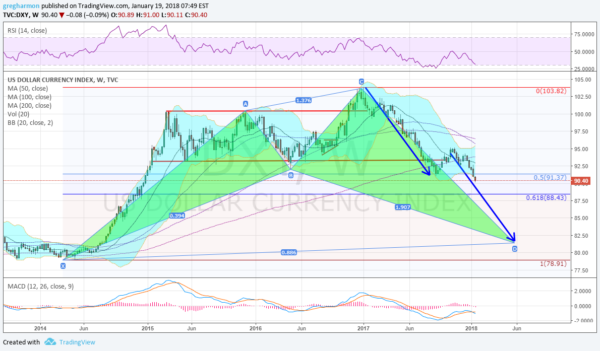
The chart below shows the decline over the course of 2017. It also shows that the move lower is gathering steam. Technical Analysis is like macro analysis in a way, it is never certain. But I like to think that technical analysts have an advantage over macro analysts as they go into the discussion knowing they might be wrong. That said, the technical picture points to a continued move lower through 2018.

There are 2 major patterns playing out in the Dollar Index. The first is a bullish Shark harmonic pattern. The two green triangles show the pattern that was triggered with a move below the 2016 low. This pattern calls for a bullish reversal, but only after retracing either 88.6% or 113% of the full pattern (88.6% is shown). This would project a move down to the 81.30 area.
The second pattern is a simple Measured Move lower equivalent to the prior drop. What makes it interesting is that targets the same area around 81.30. Momentum indicators are firmly bearish. The RSI had bounced but is now back headed lower. The MACD is also crossing down adding to the bearish momentum. The Bollinger ®Bands® had squeezed during the late 2017 bounce, but are now opening to the downside to allow a big move. As I stated earlier, there are no certainties in Technical Analysis, but the path seems to be much easier for the Dollar Index to continue the downside.
