Sometimes 10-year returns aren’t so hot and sometimes 10-year returns are sizzling hot!
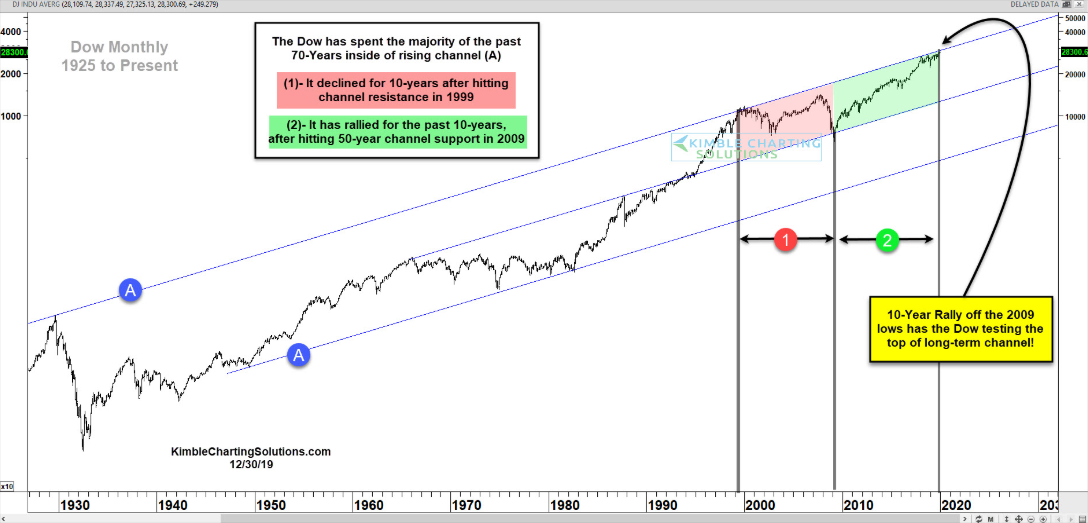
This chart looks back on the Dow Jones Index over the past 95 years (since 1925), which shows that over most of the past 50 years the Dow has remained inside of rising channel (A).
The Dow hit the top of the channel back in 1999 and in the following 10 years, the returns weren’t too impressive at (1), which encompassed the 1999 highs and the 2009 lows.
The polar opposite took place over the past decade at (2), which covered the 2009 lows to current, which shows that the past 10 years have been different than the prior 10 years.
The Billion-Dollar Question
will the next 10 years look like 1999 to 2009 or more like 2009 to 2019?
The rally over the past decade has the Dow currently testing the top of the channel, which was drawn off the 1929 and 2000 highs. A very important long-term breakout test is in play for the Dow.
