Who is Kevin Hassett? Wolfe looks at the Trump ally tipped to become Fed Chair.
The Dow Jones Industrial Average (DJI) on Tuesday suffered its fifth straight loss, weighed down by poorly received blue-chip earnings and broad concerns about bond yields. It was the Dow's longest losing streak since March 2017, when the index suffered eight consecutive down days. However, if past is prologue, this recent dip could present a buying opportunity for the DJI.
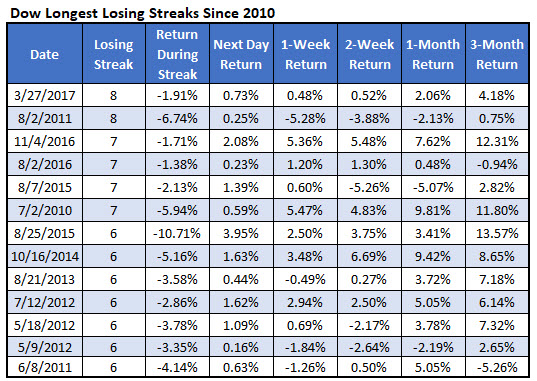
Below are the longest Dow losing streaks since 2010, courtesy of Schaeffer's Senior Quantitative Analyst Rocky White. The March 2017 retreat was actually tied for the longest during that time frame, matching a streak from August 2011. As for the severity of the decline, the March pullback closely resembles the November 2016 pre-election stretch. You'll notice that the DJI was comfortably higher both one and three months after those streaks. At last check, the index was headed for a sixth straight loss.

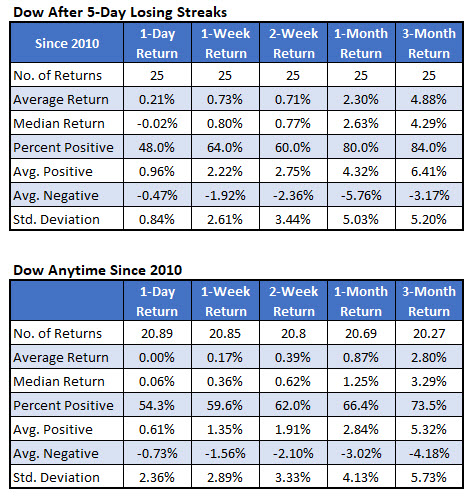
Honing in on the Dow's performance after just five-day losing streaks, we find the index tends to outperform. One week later, the DJI was up 0.73%, on average -- more than four times its average anytime one-week gain of 0.17%, looking at data since 2010. The Dow's average two-week gain after a five-day losing streak is 0.71% -- almost twice the norm.
Further, one month after a five-day losing streak, the Dow was up 2.3%, on average, and higher 80% of the time. That's compared to an average anytime one-month return of just 0.87%, with a win rate under 67%. Three months later, the index was up 4.88%, on average, and higher 84% of the time, compared to an average anytime gain of 2.8% with a win rate of 73.5%.

