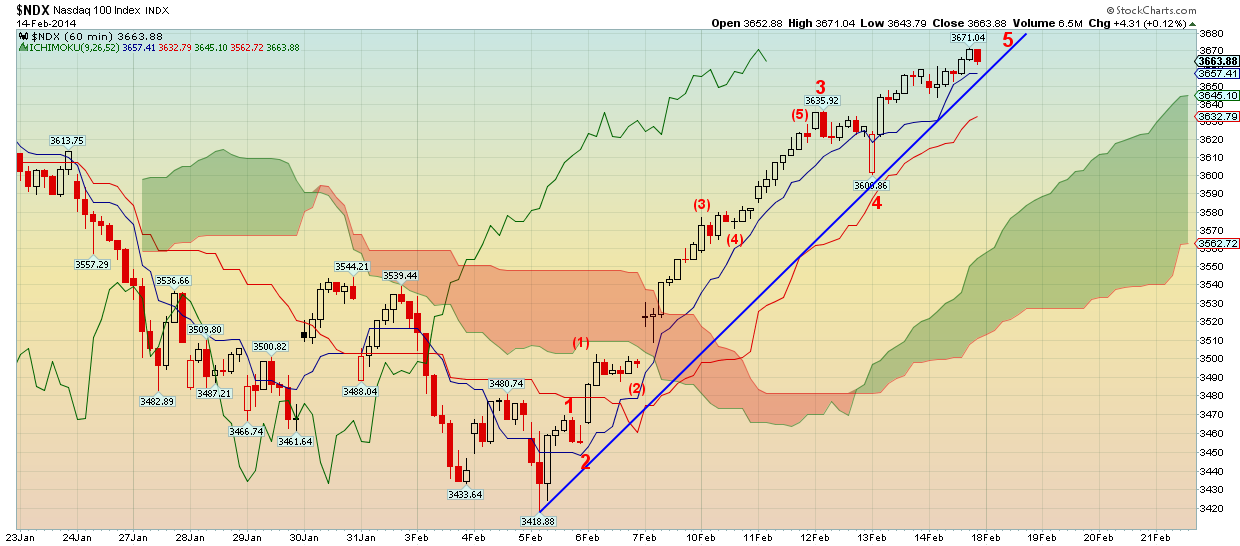
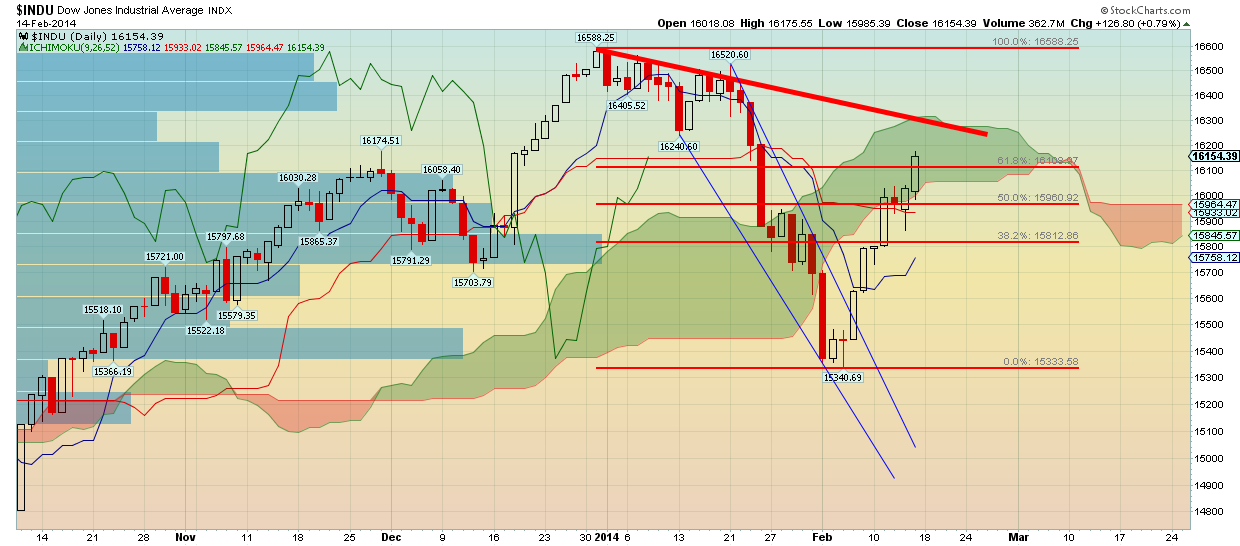
With DJI moving slightly above the 61.8% Fibonacci retracement, bulls are not as strong in this market as in Nasdaq and S&P. It is obvious that DJIA lags behind relative to those two indices. This divergence is a bearish sign for the markets. Nasdaq was expected to make a new higher high as the decline was in clear 3 waves. While S&P and DJIA made declines that could very well be impulsive, but the picture is not very clear yet. Nasadaq is close to completing its upward wave structure and soon will make a corrective pull back.

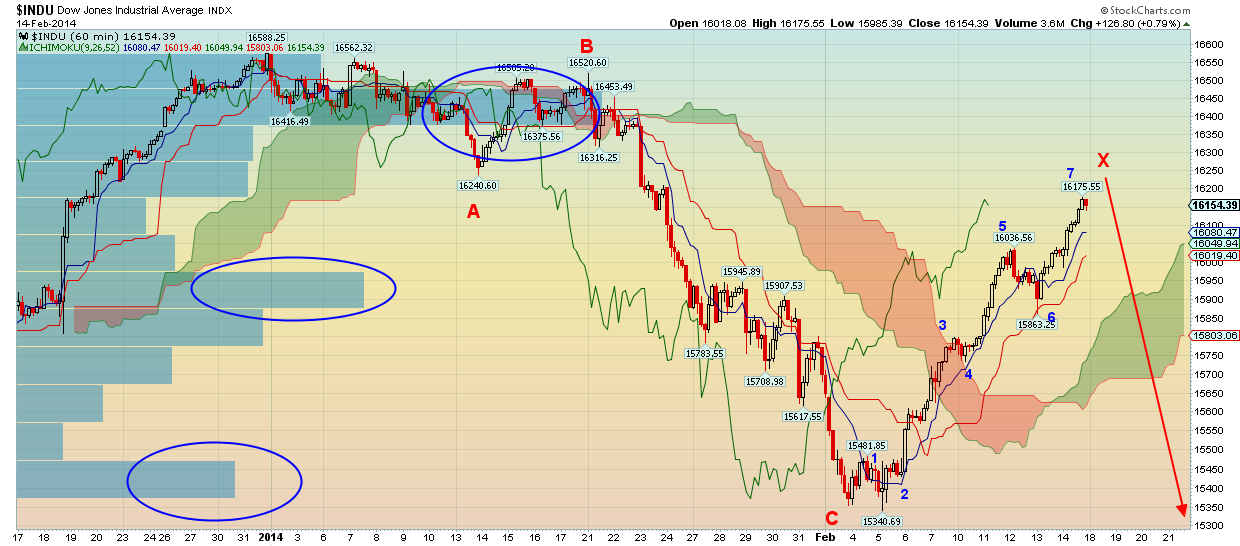
Dow Jones as shown in the chart below has made 7 waves up from its February low. This pattern is corrective. Will need to see two more waves in order to label the rise as impulsive. With our preferred scenario labeling the decline as the first part of a corrective downward move, we believe that DJIA is close to completing the second part of the correction that started in January. Once this upward move from 15340 is complete we expect a new downward leg that will push the index to new lows.

Watch carefully the volume by price bars shown in the above chart. Volume is much larger at the all time high price levels. Volume at the lows is the lowest and volume in the middle of the range is still much lower than the volume at the highs. What this means to me is that the all time highs have market an important intermediate top. This increases my chances of seeing a rejection near the highs (what I expect in S&P) and a pull back that will test the recent lows.

DJIA has moved above its 61.8% Fibonacci retracement but still trades inside the Ichimoku cloud resistance. I still believe there are increased chances of a pull back that will clear many doubts on whether we are heading towards new lows or whether we should expect a higher low. Important resistance for DJIA is found at 16300. Important support is found at 15600-15500. As near the February lows we favored long positions, we now favor neutral positions and we are ready to go short once a sell signal is given. We expect a pull back that could unfold into a bigger correction that is part of the last and third leg down with new lows in mind. For more updates and a view of my real-time trades, become a member today.
Disclosure: None of the information or opinions expressed in this blog constitutes a solicitation for the purchase or sale of any security or other instrument. Nothing in this article constitutes investment advice and any recommendations that may be contained herein have not been based upon a consideration of the investment objectives, financial situation or particular needs of any specific recipient. Any purchase or sale activity in any securities or other instrument should be based upon your own analysis and conclusions.
