The Dow Jones Industrial Average (DIA) and other major U.S. stock indexes faded late on Friday but posted a positive finish for the week and for the month of November.
The Dow Jones Industrial Average (DIA) was up fractionally for the week, 0.1% and up 3.5% for the month. The SP500 (SPY) added 2.8% for November while the Nasdaq Composite (QQQ) gained 3.6% for the month. The Russell 2000 small cap index (IWM) also gained 3.8% for November.
Black Friday sales appeared to be strong and economic reports for the Holiday shortened week were largely positive.
On My Stock Market Radar
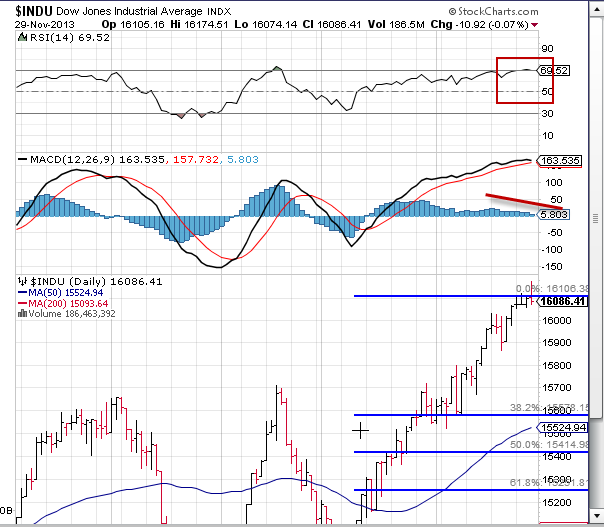
In the chart of the Dow Jones Industrial Average (DIA) below, we can see how the index remains at overbought levels and appears to be losing momentum as a short term top forms near current record levels. Should a correction occur, Fibonacci retracement tools show levels of between 15,300-15,500 as reasonable short term targets. Of course, in this world of QE and never ending rising stock prices, such events are being largely ignored by investors and traders alike.

chart courtesy of StockCharts
Nevertheless, a number of warning flags are flying that shouldn’t be ignored:
1. Investor and advisor sentiment are running at or near all time highs which is a bearish. In the AAII Sentiment Survey for the week ending 11/27, bullish sentiment was at 47.3%, up 12.9 from last week and well above the long term average of 39%. Bearish sentiment was at 28.3% down 1.2 from last week and below the long term average of 30.5%.
Among money managers, the National Association of Active Investment Managers reported a NAAIM number of 101.45, up from last quarter’s average of 65.40 and the previous week’s 87.43, the second highest reading on record for this metric.
Investors Intelligence points out in its most recent sentiment report that the number of advisor bears has dropped to its lowest point since March, 1987, 14%, so bears are virtually nowhere to be seen and such numbers have typically accompanied notable market tops.
2. The Shiller P/E is at 25.4, a level only exceeded in 1929, 1999 and 2007.
3. Margin debt on the New York Stock Exchange is at record highs and comparable to levels seen in 2000 and 2007.
Stock Market News You Can Really Use
Last week’s economic reports saw building permits climb, beating expectations, and the Case/Shiller Home Price Index showing yearly gains. Weekly unemployment claims fell, October durable goods orders declined, along with Chicago PMI.
This coming week will be back to business as usual with a full trading week and economic reports to include:
Monday: November Markit PMI, November ISM
