Dow Jones Index – Stuck in 70 Point Range Consolidation
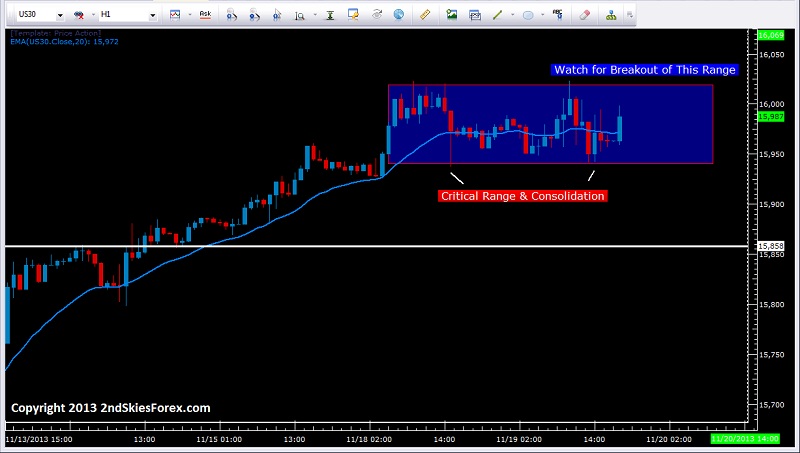
As the uptrend keeps on truckin’ along, for the last two days the US index has been going through a re-distribution phase at the all time highs between 16024 and 15950. This consolidation can be clearly seen in the 1hr chart below. Intra-day traders can look to play the range until we get a breakout and 1hr close on either side.
For now, I’m still holding my bullish based on the current price action. However if this re-distribution phase starts to print LH’s (lower highs) and a breakout to the downside occurs, we could see a pullback to 15850 before bulls look to get back in and re-attack the ATH (all time high). If this downside breakout plays out, and follow through buying fails to take out the ATH, then this would likely signal the beginning of a bear move.
Original post