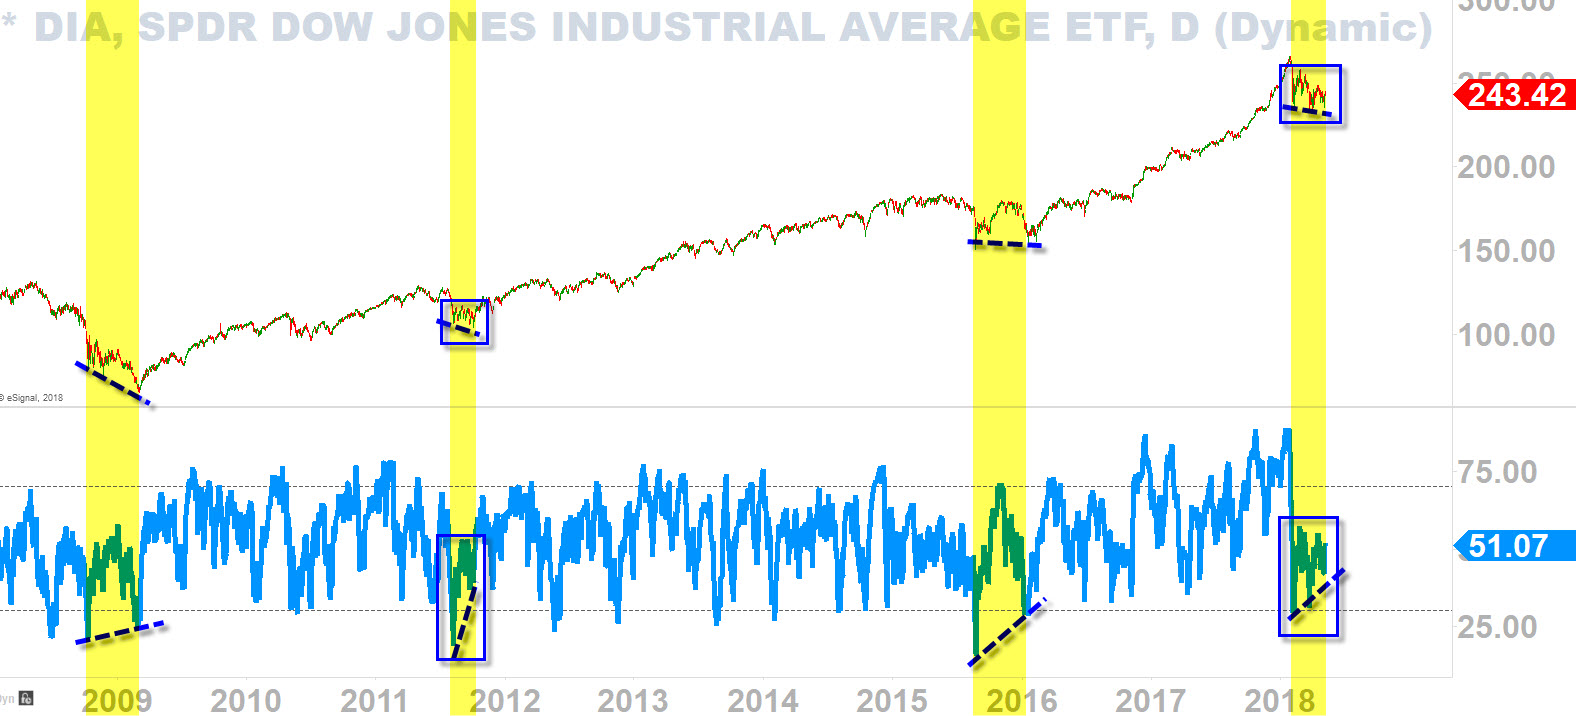
Since the crash of 08, we can identify that this signal has shown up a total of four times including today. Bottom indicator is RSI and this is what we call a bullish divergence--price prints lower lows while the indicator prints higher lows, as you can see highlighted. This event typically occurs and signifies that the sellers are getting exhausted while the 'smart money' is clandestinely accumulating/buying stocks exploiting the exhaustion state of the sellers. That's why you are seeing the divergence from the price-action and the indicator showing the sentiment of what's really going on underneath the hood (which is that sellers are getting exhausted). * A similar signal has appeared on XLF (Financial Sector) as I published my analysis yesterday here on my blog.
Here are the pros and cons,
PROS:
- It has not failed to reignite the bull market after the correctional phase in last 10 years (highlighted: 2009, 2011, 2015-2016).
- Once the bull market is reignited, the rally can last as long as two to three years (!!).
- This is not a signal you will see in a 'market crash' scenario.
- This is good news for the investors and long-term traders like myself.
CONS:
- It could take up to a month or more before confirmation.
- This signal is not for short-term or day traders.
- This does not mean we will see a "V" shape reversal tomorrow.
The current price-action is most similar to 2011's correction as it (today) resembles (see blue boxes) the tight consolidation phase it had been in for a multi-month period.
SPDR Dow Jones Industrial Average (SI:SPDR) (NYSE:DIA)

