Forex News and Events
The FOMC gives policy verdict today and is expected to announce the end of the QE3 program. This is the base case scenario stipulating that the Fed will proceed with 15 billion dollar cut in its monthly asset purchases and will fully stop buying both treasuries and mortgage-backed securities. Anything below 15 billion dollar cut will be perceived as dovish and should reinforce the recent downside correction in USD. In this side scenario, the Fed would continue reducing its monthly bond purchases by the regular 10 billion dollars and leave the last 5 billion dollar for the next meeting. Although the difference in nominal terms is relatively low, the message it would deliver to the market should undoubtedly lead to further dovish shift in expectations regarding the Fed policy outlook.
As the asset purchases program approach the end, traders will continue chasing more details on the timing of the first Fed fund rate hike. The critical question is how long the “considerable time” before the first rate hike may be. We believe that the Fed will keep its cautious stance and will remain flexible in its communiqué in order to give itself a safe maneuver margin. A hawkish surprise would be the removal of “considerable time” phrase to increase the emphasis on a data-dependent game plan. This would shift the focus back to the labor market (unemployment rate, wages growth) and the price dynamics. Given that the unemployment rate has fallen below 6.0% in September reading, the perception of such modification can only be USD-positive. Although the PCE core price index (which is the key inflation indicator watched by the Fed) stabilized at 1.5% in August and gives some flexibility to Fed before the first rate action.
The rate markets price in a dovish shift in expectations for the first FF hike. According to implied probabilities, the expectations of higher Fed fund rate by June 2015 decreased from 85% to 59% since September 17th FOMC meeting. The US treasury curve has clearly packed down, the back-end of the curve flattened by more than 30 basis points since last meeting. Traders need to get more clarity on Fed’s future plans, while we believe that it is not the right time yet.
BRL, TRY, ZAR extend gains
The broad based USD weakness and lower oil prices profit to countries with high current account deficit and high UST sensitivity. In this context, TRY, BRL and ZAR are ranked as the most beta-sensitive pairs to both factors; the short-run dynamics are therefore highly dependent on USD moves. As the USD/BRL corrects the aggressive post-election rally, USD/TRY and USD/ZAR advance towards their respective 100-dma (2.1787 & 10.8189). USD/TRY trades below 2.20 for the first time since mid-September.
In the absence of hawkish news from the FOMC, we see room for deeper correction in USD/TRY and target 2.17 /2.1871 trading band (the Fibonacci 50% on January-May sell-off / 200-dma). USD/ZAR should head down to 10.50/80 pre-September range. In the longer-run however, we keep our positive outlook for USD and keep our USD/TRY target unchanged at 2.20 by year-end, 2.25 in Q1, 2015; USD/ZAR forecasts remain unchanged at 11.50 by year-end and 11.80 in Q1, 2015.
The USD/BRL should hold ground at 2.40/2.45 (Fib 61.8% / 21-dma) walking into today’s FOMC decision. The long-term expectations will depend on how the freshly re-elected President Rousseff’s new team manages to shift toward more eco-liberal policies. A political disappointment will shift the focus to 2.60/2.75 area in three-six month period.
Swissquote SQORE Trade Idea:
Commodity + Index Model: Sell OILUSD at 82.31.
For trade details & more great trade ideas, visit Swissquote SQORE platform:

Today's Key Issues (time in GMT)
- 2014-10-29T11:00:00 USD Oct 24th MBA Mortgage Applications, last 11.60%
- 2014-10-29T12:30:00 CAD Sep Industrial Product Price MoM, exp -0.10%, last 0.20%
- 2014-10-29T12:30:00 CAD Sep Raw Materials Price Index MoM, exp -0.90%, last -2.20%
- 2014-10-29T18:00:00 USD Fed QE3 Pace, exp $0B, last $15B
- 2014-10-29T18:00:00 USD Fed Pace of Treasury Pur, exp $0B, last $10B
- 2014-10-29T18:00:00 USD Fed Pace of MBS Purchases, exp $0B, last $5B
- 2014-10-29T18:00:00 USD FOMC Rate Decision (Upper Bound), exp 0.25%, last 0.25%
- 2014-10-29T18:00:00 USD FOMC Rate Decision (Lower Bound), exp 0.00%, last 0.00%
- 2014-10-29T20:00:00 NZD RBNZ Official Cash Rate, exp 3.50%, last 3.50%
The Risk Today
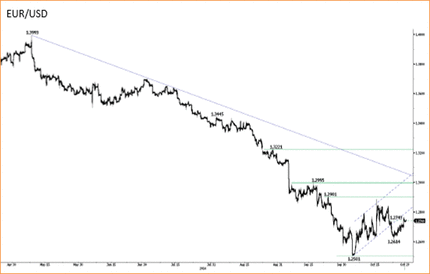
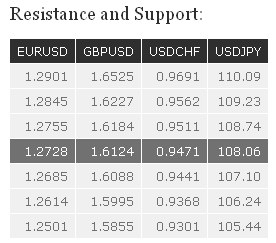
EURUSD EUR/USD has breached the hourly resistance at 1.2743, suggesting some increase in buying interest. Despite the current lack of follow-through, the short-term bullish momentum remains supportive as long as the hourly support at 1.2685 (28/10/2014 low) holds. Another hourly support can be found at 1.2614. A key resistance lies at 1.2845 (16/10/2014 high). In the longer term, EUR/USD is in a downtrend since May 2014. The break of the strong support area between 1.2755 (09/07/2013 low) and 1.2662 (13/11/2012 low) has opened the way for a decline towards the strong support at 1.2043 (24/07/2012 low). As a result, the recent strength in EUR/USD is seen as a countertrend move. A key resistance stands at 1.2995 (16/09/2014 high).
GBPUSD GBP/USD needs to break the resistance area between 1.6184 (21/10/2014 high) and 1.6227 to improve its technical structure. An initial support lies at 1.6088 (28/10/2014 low), while a more significant support stands at 1.5995. In the longer term, given the significant deterioration of the technical structure since July, the strong resistance area between 1.6525 (19/09/2014 high) and 1.6644 (01/09/2014 high) is expected to cap any upside in the coming months. Monitor the current consolidation phase near the strong support at 1.5855 (12/11/2013 low).
USDJPY USD/JPY has recently displayed some weakness near the resistance at 108.35, which favours a corrective phase. However, the rising channel remains thus far intact. Hourly supports can be found at 107.61 and 107.10. Another resistance can be found at 108.74. A long-term bullish bias is favoured as long as the key support 100.76 (04/02/2014 low) holds. Despite the recent decline near the major resistance at 110.66 (15/08/2008 high), a gradual move higher is eventually favoured. Another resistance can be found at 114.66 (27/12/2007 high). A key support lies at 105.44 (02/01/2014 high).
USDCHF USD/CHF has broken the support at 0.9473, suggesting increasing selling pressures. An hourly support lies at 0.9441 (intraday low, see also the rising trendline). A key support stands at 0.9368. An hourly resistance can now be found at 0.9511 (28/10/2014 high), while a key resistance is at 0.9562. From a longer term perspective, the technical structure favours a full retracement of the large corrective phase that started in July 2012. As a result, the recent weakness is seen as a countertrend move. A key support can be found at 0.9301 (16/09/2014 low). A resistance now lies at 0.9691 (06/10/2014 high).

