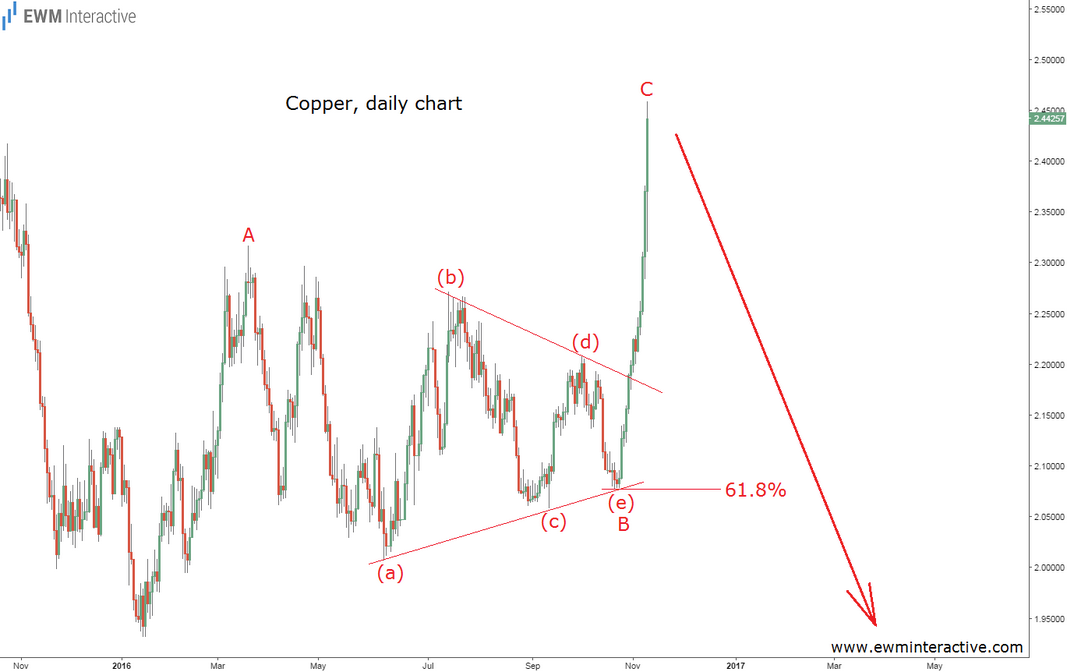
Copper has been making headlines recently after it left the consolidation area it was locked in and jumped to as high as 2.4589 as of today. Usually, when people see that something is rising in price, they rush to buy it. This has never been our way of doing things. In order to put your money at risk, you must have a better reason than just a rising price. Copper seems to be giving us another example of a deceptive rally. Its daily chart, below, explains why.

The Elliott Wave Principle states that once a correction is over, the larger trend resumes. As visible, copper’s entire recovery from 1.9322 could be seen as an A-B-C zig-zag retracement. In addition, wave B is a triangle, which makes it even easier to understand its corrective nature. Triangles precede the last wave of the sequence. This means that once wave C is over, a bearish reversal should occur. Waves A and C are equal in length, meaning wave C might have topped out already. This leads us to the conclusion that despite copper’s impressive recovery, now is not the time to join the bulls.
The long-term downtrend is still in progress and lows below 1.9000 are still on the table.
