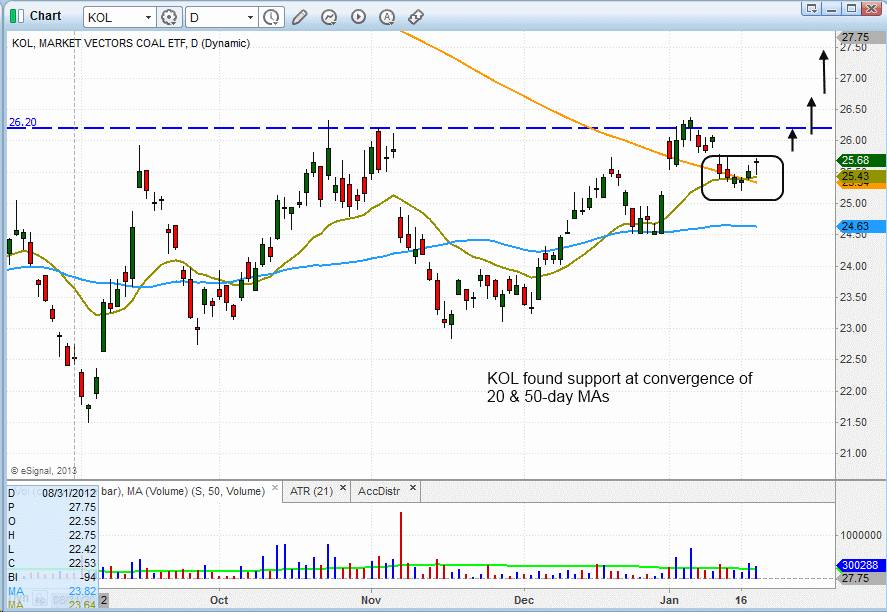
In our January 10 commentary, we said Market Vectors Coal ETF (KOL) could pull back to find near-term support in the area of both its rising 20-day exponential moving average and 200-day moving average (around $25.50). Specifically, we said:
We would ideally like to see the price action retrace down to its 200-day moving average and form some sort of bullish reversal candlestick pattern. If this occurs, it would subsequently provide us with a very low-risk swing trade buy entry.
In the days that followed, that’s exactly what happened. This is shown on the annotated daily chart of KOL below:
The support level at convergence of the moving averages (last week’s lows) looks as though it will hold. If it does, it will create another higher “swing low” on the right side of the base of consolidation. As we have pointed out several times in recent weeks, a valid base of consolidation should consist of both “higher lows” within the base, as well as tightening of the price action. KOL presently meets this technical criteria.
Because the price action of KOL has been playing out exactly as anticipated, we are now stalking this ETF for potential swing trade buy entry going into today’s session. Although this is a “trend reversal” setup, rather than a potential breakout to new highs, we like the reward-risk ratio for trade entry near its current price.
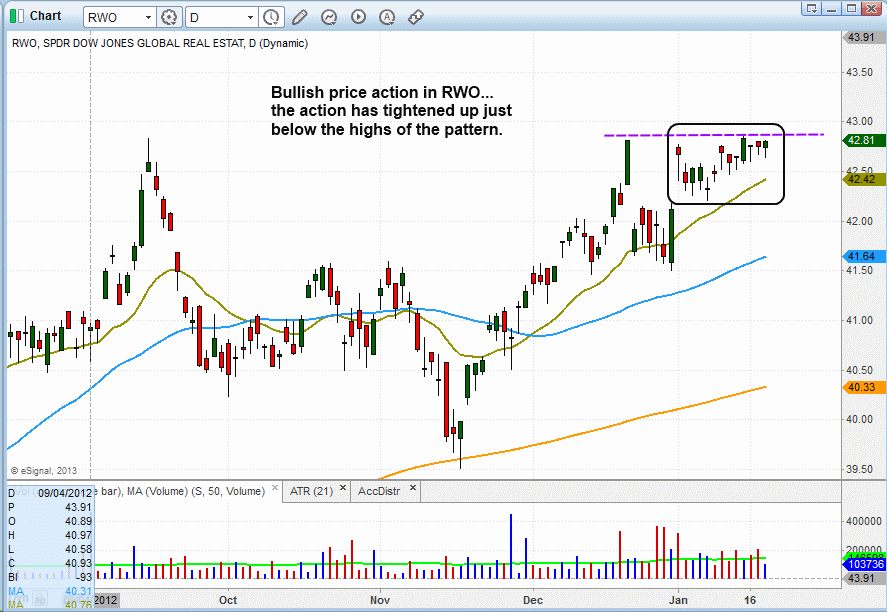
Another ETF poised to rally in the coming days is SPDR Dow Jones Global Real Estate ETF (RWO), which continues to consolidate in a tight range beneath the highs of its current base. Starting from the beginning of the basing pattern in September, the price action in RWO is a good example of what we look for when identifying bullish price action within a base: 
When looking at a base of consolidation, we typically see more volatility on the left hand side of the pattern, as the stock/ETF initially pulls back from its highs, enters distribution mode, and sells off for several weeks. At one point during the decline, the price action will either “undercut” a previous low and reverse higher or simply explode higher and hold. This usually occurs after the stock/ETF breaks out above the downtrend line from the high of its base, which subsequently leads to the “right side” of the pattern developing with the formation of “higher swing highs” and “higher swing lows.”
With RWO, notice that the price action bottomed out by undercutting its prior swing low and then reversing sharply off major support of its 200-day moving average (orange line). Since then, the ETF has formed a series of higher highs and lows, with the price action tightening up just below the highs of the base. Note that this tightening of the price does not always have to form just below the highs of the base, as it could form anywhere from 5-10% off the highs and still be technically valid. Regardless, we like the recent price action in RWO and expect the ETF to soon break out above the highs of the range.
Original post
- English (UK)
- English (India)
- English (Canada)
- English (Australia)
- English (South Africa)
- English (Philippines)
- English (Nigeria)
- Deutsch
- Español (España)
- Español (México)
- Français
- Italiano
- Nederlands
- Português (Portugal)
- Polski
- Português (Brasil)
- Русский
- Türkçe
- العربية
- Ελληνικά
- Svenska
- Suomi
- עברית
- 日本語
- 한국어
- 简体中文
- 繁體中文
- Bahasa Indonesia
- Bahasa Melayu
- ไทย
- Tiếng Việt
- हिंदी
Don’t Miss These Two ETFs Which Are Ready To Breakout This Week
Published 01/23/2013, 12:46 AM
Updated 07/09/2023, 06:31 AM
Don’t Miss These Two ETFs Which Are Ready To Breakout This Week
Latest comments
Loading next article…
Install Our App
Risk Disclosure: Trading in financial instruments and/or cryptocurrencies involves high risks including the risk of losing some, or all, of your investment amount, and may not be suitable for all investors. Prices of cryptocurrencies are extremely volatile and may be affected by external factors such as financial, regulatory or political events. Trading on margin increases the financial risks.
Before deciding to trade in financial instrument or cryptocurrencies you should be fully informed of the risks and costs associated with trading the financial markets, carefully consider your investment objectives, level of experience, and risk appetite, and seek professional advice where needed.
Fusion Media would like to remind you that the data contained in this website is not necessarily real-time nor accurate. The data and prices on the website are not necessarily provided by any market or exchange, but may be provided by market makers, and so prices may not be accurate and may differ from the actual price at any given market, meaning prices are indicative and not appropriate for trading purposes. Fusion Media and any provider of the data contained in this website will not accept liability for any loss or damage as a result of your trading, or your reliance on the information contained within this website.
It is prohibited to use, store, reproduce, display, modify, transmit or distribute the data contained in this website without the explicit prior written permission of Fusion Media and/or the data provider. All intellectual property rights are reserved by the providers and/or the exchange providing the data contained in this website.
Fusion Media may be compensated by the advertisers that appear on the website, based on your interaction with the advertisements or advertisers.
© 2007-2025 - Fusion Media Limited. All Rights Reserved.
