The big story of the weekend was that a meeting of OPEC and non-OPEC producers, at which an agreement was supposed to be signed to freeze oil production at recent levels, ended without an agreement being signed. This was not an enormous surprise, since Iran didn’t even attend the conference and the Saudis had said they wouldn’t sign unless Iran agreed, but oil prices initially took a significant hit before recovering some later in the day.
The economic significance of the lack of agreement is fairly small; most producers are producing near their maximum output, except for important non-attendees like the United States and Iran. (The Saudis claim to be able to put 1mm barrels per day online in short order, too.) But the psychological significance was thought to be important.
I’m not so sure about the importance of mind-games in an efficient global market for a commodity product. The market is oversupplied, by a significant amount, and no amount of posturing will change that. However, basic economics may.
Overlooked by many is the fact that OPEC’s problem is one that automatically diminishes over time even if OPEC does nothing. This is because the demand for oil is short-term inelastic, but long-term elastic.
The elasticity of demand describes how quickly the quantity demanded responds to price. If demand is very elastic, then changes in price cause large changes on the quantity demanded. On the other hand, inelastic demand curves indicate that the quantity demanded changes very little when the price on offer changes.
The elasticity of demand has a very significant consequence for the question of how revenues change when prices change. Revenue is simply price times quantity. So, if a small change in price causes a large change in quantity (that is, an elastic demand curve), it is a good strategy (for example, as an individual company) to cut one’s price: the company will sell lots more product and give up only a little revenue on each one, so that total revenues rise with price declines if a producer faces an elastic demand curve. On the other hand, if demand is inelastic, then a price cut doesn’t change the quantity sold very much, but decreases revenue on each unit.
If a producer faces an inelastic supply curve, total revenues decline with price decreases. And, conversely, total revenues increase with price increases in such a case. This is the reason that cartelization of the oil industry is an apparently attractive strategy: oil demand is, at least in the short-run, price inelastic. If gasoline prices rise $1 per gallon next week, you will still drive almost as much as before.
But static equilibria cannot fully describe dynamic markets. It turns out that for most products, demand elasticity in the long-run is higher, and often much higher, than in the short run. Consumers adjust to changing prices by adjusting their consumption mix! This is also true with energy markets: while you won’t drive a lot less next week if gasoline prices are much higher, if they stay higher you will start to carpool, buy more energy-efficient vehicles, and so on.
This is one reason that cartelization ends up failing. In the short run, it makes sense to band together and hike prices, raising overall revenue. However, this has deleterious effects on long-run revenue and creates incentives to cheat to grab more of the (diminishing) demand.
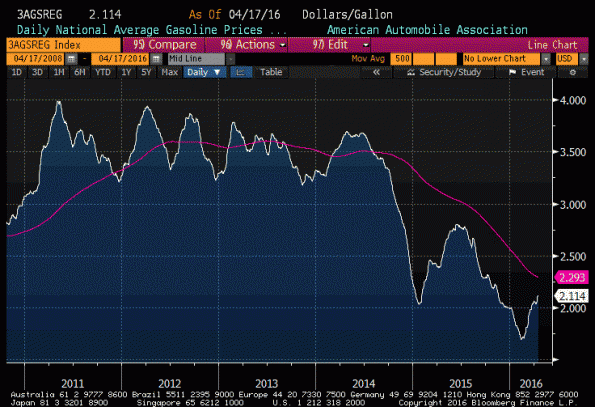
Analysis of the energy markets tends to focus on supply, but as prices increase and decrease over extended periods of time, it is important to remember that demand eventually responds. From 2011 until mid-2014, retail gasoline averaged about $3.50 per gallon (see chart below, source Bloomberg). But it has been below that level for almost two years, and averaged more like $2.30 per gallon since then.
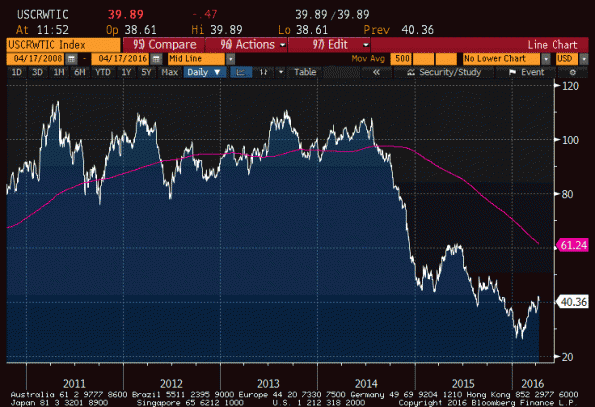
Similarly, WTI crude oil averaged around $100/bbl in 2011-mid2014, but only about $60 since then. And most of that was well below $60. The picture for Brent is of course very similar.
In the short run, with inelastic demand, these large declines represent a very big drop in OPEC producer revenues. But in the long run – and after two years, we are much closer to the long run – demand will increase even if the global economy doesn’t grow at all because there is a demand response to lower prices. OPEC, in other words, initially sold the same amount of oil at lower prices, but as time passes they will sell larger amounts of oil at these lower prices. While that’s not as good as selling those larger amounts of oil at higher prices, it is better than what it had been after the initial, sharp decline.
So oil producers will have more total revenue over the next year, even if price doesn’t change and even if the global economy stops growing, than they did last year. The need for a production freeze becomes less urgent all the time.
Of course, the supply overhang is huge, and it won’t go away overnight and probably won’t go away from demand response alone. But, as we are dealing with the long run, we shouldn’t neglect the demand response, either.


