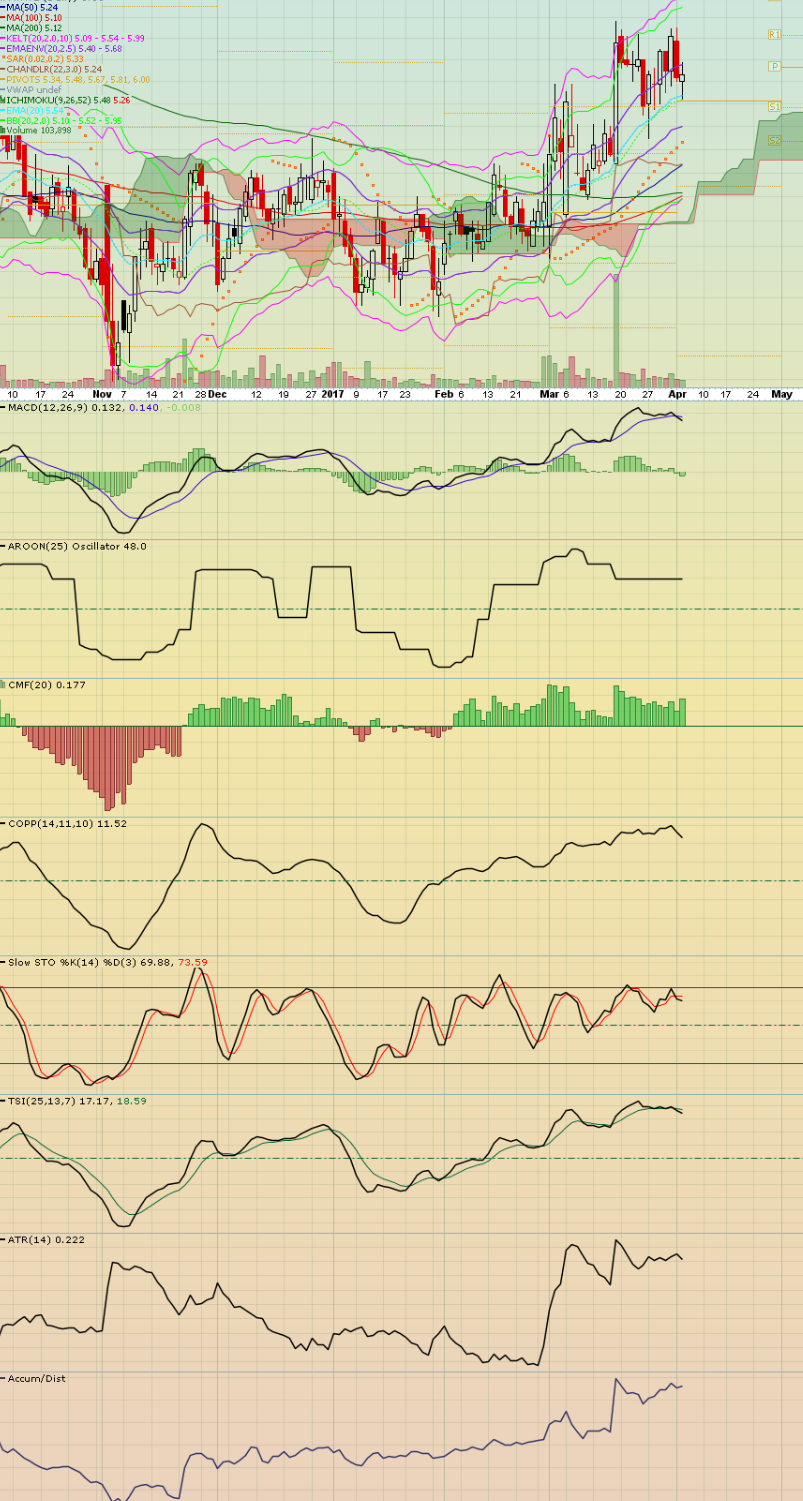
Plenty of traders use charts of price action to set their trading plan. And there are many different variations on how to interpret the data. To gain an edge technicians continually work with the data, looking for a signal that can get the exact turning point in price. Picking the bottom or the top. This has led to a myriad of tools from manipulated data: Price Indicators. Most charting services offer at least 20 of them, and each one can be customized in 3 or 4 different ways. That gives a lot of leeway for the experimenter to play around and find what works for them.
It can also lead to traders using multiple indicators. One confirming a second that confirms a third, which then confirms a trade entry. I have seen charts with 15 or more indicators used. If you need 15 indicators do you really have an edge? And what to indicators really get you? They are called indicators for a reason. They are not price but an indication of what price might do. Can this chart below really give you an edge?

I liken indicators to the blinker on your car. They can often tell you what will happen, but not when. When the driver in front of you turns on their blinker to turn left or change lanes, they are giving you a signal of their intention. But will the turn be immediate or two driveways further. You do not know. And what about that car that is driving the left lane with its left blinker on mile after mile. There was an intention to move at some point but nothing is happening.
Blinkers on cars are useful but until the car actually starts to turn or change lanes they are just a signal. Like indicators on a price chart can give a perspective of what might happen but need to be confirmed by a change of price. If you are acting solely on indicators you are likely finding your trades stopped out or reversing for a loss more often than you would like. Wait for price to confirm a trade entry and you will be more successful.
