The global economy has $57 trillion more debt now than it did at the last bubble peak in 2008. The energy sector alone has $248 billion in junk bond debt – some of the riskiest debt there is!
Entire industries have been built upon this credit-fueled bubble, driven by the easy-money policies of central banks around the world.
And now that this bubble is in the early stages of bursting, we’ll see some of these industries begin to cave in the short months ahead!
Amongst them, the single greatest threat to American soil – as I’ve been warning for months – is the U.S. fracking industry.
And whereas central banks could stave off the decline of the stock market during the last crisis, this time, they’ve met their match!
As I stated in the latest issue of Boom & Bust, in which I explain why there’s no stopping this train wreck about to happen:
The bigger the bubble the greater the burst… and almost all bubbles burst twice as fast as they are built. I have measured this by looking at every major bubble in history, from stocks to commodities to real estate to bonds to tulips. It’s always the same.
The very existence of the fracking industry depends on the long-term sustainability in oil prices. For them, that’s above $80. It’s like everyone behind the operation forgot that oil is one of the most volatile commodities on the planet!
Thirty years ago, oil fell off its peak (which, at the time, was just above the $30 mark) and lost more than two-thirds of its price in four months.
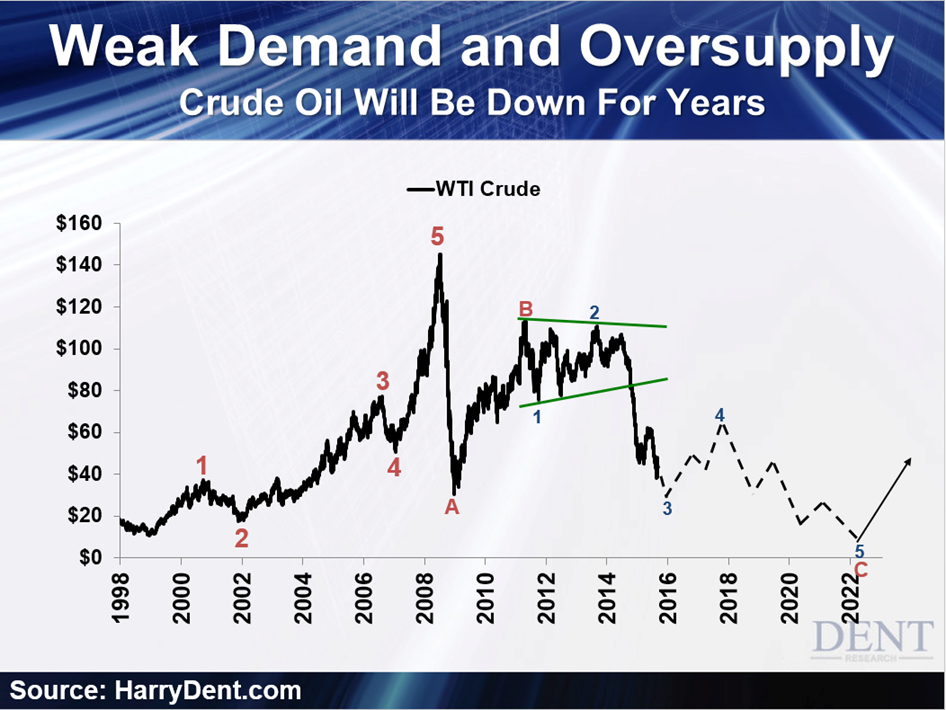
Then during the last bubble, oil soared to $147, and crashed to $32. That was a 78% drop in roughly the same time – four and a half months!
And now it’s crashing again, on its way to test that $32 low from 2008. Until recently, I saw this happening by January. But at the rate it’s been going, I’m thinking now it will happen by mid-October!
The bounce this past week from $38 to $48 is just a temporary blip in a longer slide downward. I could see oil climbing $80 again, but not for a decade, at least! I see it bottoming around the $8 to $20 mark by 2020 and possibly earlier, but by 2023 at the latest. See below:

All this is to say, fracking’s toast! It would have never been viable if QE hadn’t bubbled oil prices back up temporarily and pushed junk bond borrowing costs from 8% to 5%.
Once their current wells go dry, they will not be able to afford new ones. Not at these levels.
And if oil ever does return to that $80 level where fracking breaks even, by then the industry will be long-since dead! Commodities like oil take a long time to recover when free money isn’t artificially propping them up.
Beyond all this, oil’s devastation bears deeper implications for the U.S. and global economies.
Soon the frackers will start defaulting on the junk bonds they used to get the industry off its feet. When that happens, it could start a bond market crisis worse than the subprime crisis of 2006, as there are more junk bonds and much more global debt now.
And remember – it took defaults in just four U.S. states for the subprime crisis to develop into a full-blown global financial crisis in 2008!
It will happen again, this time for the frackers. And when it does, it’ll be worse than 2008 – possibly worse than 1929. Our stockpiles of debt almost guarantee it.
