Forex News and Events
BoE could praise the devalued pound
"A few days after the flash crash which sent the GPB/USD below 1.2000 before bouncing back, it is alarming that no concrete cause has been found. Many are blaming altos, but what would be the rationale to justify such a sell-off during the Asian session? Others claim that a fat finger order was behind the brutal move.
Even though such issues are concerning, especially as they bring the FX market's microstructure into question, it does not change our fundamental view on the pound. We believe that it is a good opportunity for traders to reload their long positions. The Brexit consequences have been largely over-exaggerated and the nightmare scenario that was promised in the wake of the Brexit referendum has not played out as dramatically as expected.
A Brexit is definitely not the end of the world. Moreover, the devalued pound will see UK exports gain momentum within the next few months and the country is currently enjoying its lowest house price growth in three years. However, we remain cautious as a more-than-expected hawkish Fed could send the cable lower. This has not happened in recent decades but the Fed’s quest for credibility could take markets by surprise
Don't follow USD or oil higher
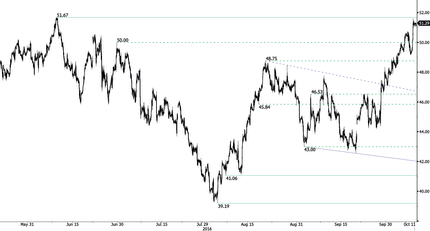
At the World Energy Congress in Istanbul, Russian President Vladimir Putin suggested that he was ready to coordinate with OPEC to manage production. Saudi Arabia indicated that other non-OPEC nations were ready to join a reduction agreement, while the Saudi energy minister stated that he could see crude prices at $60 in a few months. Finally, Chinese manufacturing activity showed solid growth providing further impetus for a commodity rally. The higher oil prices gave equity markets a much need valuation rational to head higher.
The oil & gas sector plays led the broad based rally. The Russian and Saudi commentary-driven positive outlook allowed WTI crude to trade above the $51 brl handle for the first time since June. In the FX markets, the higher oil prices triggered USD buying across the board, as did increased investor demand for US equities.
However, we still suspect that the current USD rally is unsustainable. Firstly, we have heard this type of production limit commentary many times with agreements falling apart significantly prior to execution. Given the weak macro underlying oil fundamentals, we would be hard pressed to chase this rally higher. It’s more likely that a Yemen driven military tension/conflict at that Bab-el-Mandeb Strait will drive prices higher.
Secondly, higher oil prices have an indirect tightening effect on the US consumer. The Fed is unlikely to add additional tightening with an official monetary policy interest rate hike should the WTI price increase become entrenched. Should the threat of higher energy prices remain, we should hear Fed decelerating rate hike rhetoric, sending yield seeking investors out of the USD. In this environment of low inflation low growth, we remain constructive on EM currencies. We see USD/ZAR's recent bullish rally and rogue spike due to FinMin Gordhan was charged with fraud today as opportunity to reload shorts.


The Risk Today
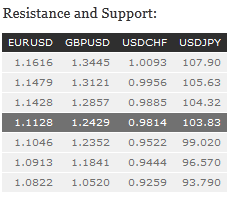
EUR/USD has now definitely erased support at 1.1123. Yet, a further decline towards the strong support at 1.1046 (05/08/2016 low) is favoured, as long as prices remain below the resistance at 1.1288 (declining trendline). In the longer term, the technical structure favours a very long-term bearish bias as long as resistance at 1.1714 (24/08/2015 high) holds. The pair is trading in range since the start of 2015. Strong support is given at 1.0458 (16/03/2015 low). However, the current technical structure since last December implies a gradual increase.
GBP/USD has collapsed in Asia trading last Friday, with reports of 1.14 lows and its recovery around the 1.2424 handle seems over. Resistance is located at 1.2620 (declining trendline) then 1.2873 (03/10/2016). Support base is now building at 1.2228 (07/10/2016 low). Expected to show continued downside pressures. The long-term technical pattern is even more negative since the Brexit vote has paved the way for further decline. Long-term support given at 1.0520 (01/03/85) represents a decent target. Long-term resistance is given at 1.5018 (24/06/2015) and would indicate a long-term reversal in the negative trend. Yet, it is very unlikely at the moment.
USD/JPY is back around resistance given at 104.32 (02/09/2016 high).The ongoing momentum is mixed. Hourly support is located at 102.81 (10/10/2016 low) and 100.09 (27/09/2016). We favor a long-term bearish bias. Support is now given at 96.57 (10/08/2013 low). A gradual rise towards the major resistance at 135.15 (01/02/2002 high) seems absolutely unlikely. Expected to decline further support at 93.79 (13/06/2013 low).
USD/CHF keeps on increasing slightly since September 15. Key resistance lies at 0.9950 (27/07/2016 high). Support can be located at 0.9733 (05/10/2016 base) then 0.9632 (26/08/2016 base low). Expected to see continued increase. In the long-term, the pair is still trading in range since 2011 despite some turmoil when the SNB unpegged the CHF. Key support can be found 0.8986 (30/01/2015 low). The technical structure favours nonetheless a long term bullish bias since the unpeg in January 2015.

