💎 Fed’s first rate cut since 2020 set to trigger market. Find undervalued gems with Fair ValueSee Undervalued Stocks

Don't Believe The Rally In Gold, Silver And Miners Just Yet

Published 06/10/2016, 01:04 AM
Updated 07/09/2023, 06:31 AM
XAU/USD
-
XAG/USD
-
GC
-
SI
-
HUI
-
GDX
-
GDXJ
-
DXY
-


Miners have broken to new highs, and some indicators are already in overbought territory. It’s hard for me to believe that gold miners are already overbought just two weeks into a new intermediate-term cycle. I’m skeptical; this could be a false breakout and prices could drop to their 200-day moving averages. Here is an update I released before the Thursday close explaining the breakaway gap in GDX (NYSE:GDX). The next two weeks have huge implications for gold, silver and miners…we need to remain vigilant.

-US DOLLAR- The dollar made a bullish engulfing pattern today. A close above 94.12 and then again above the 10-day moving average will confirm a cycle low, and prices should move higher once again.
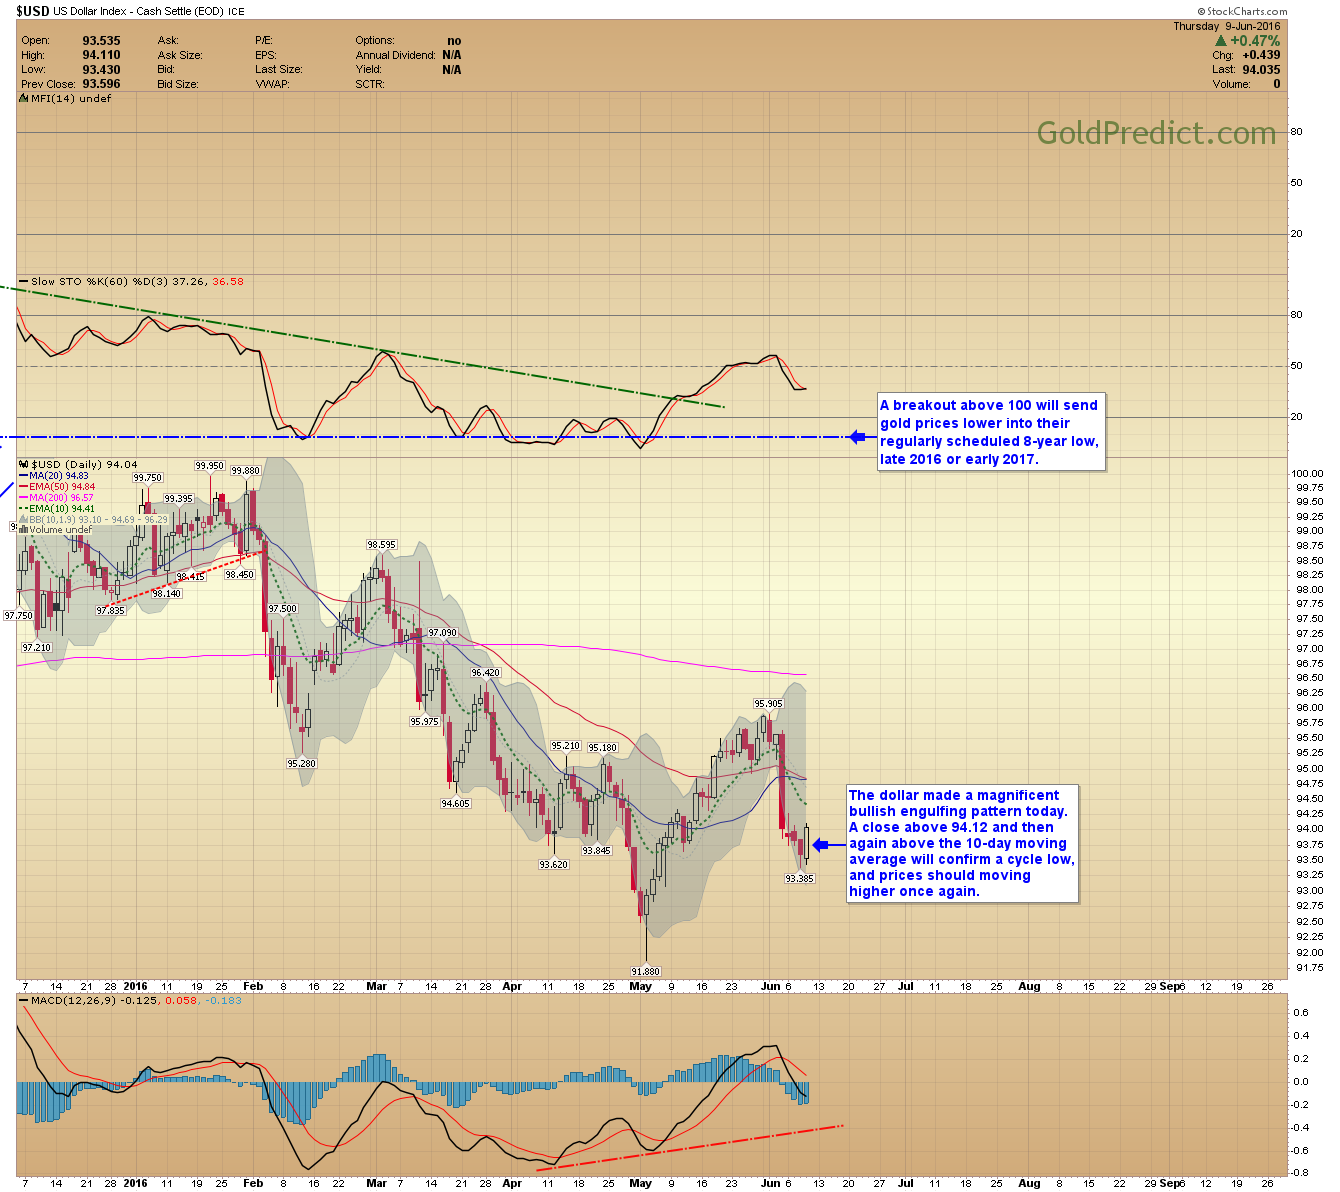
US Dollar Index Daily Chart

-GOLD- Gold prices broke the trendline. However, this close to the $1,306 high we should wait for that level to be convincingly breached before a new Color Code is issued.
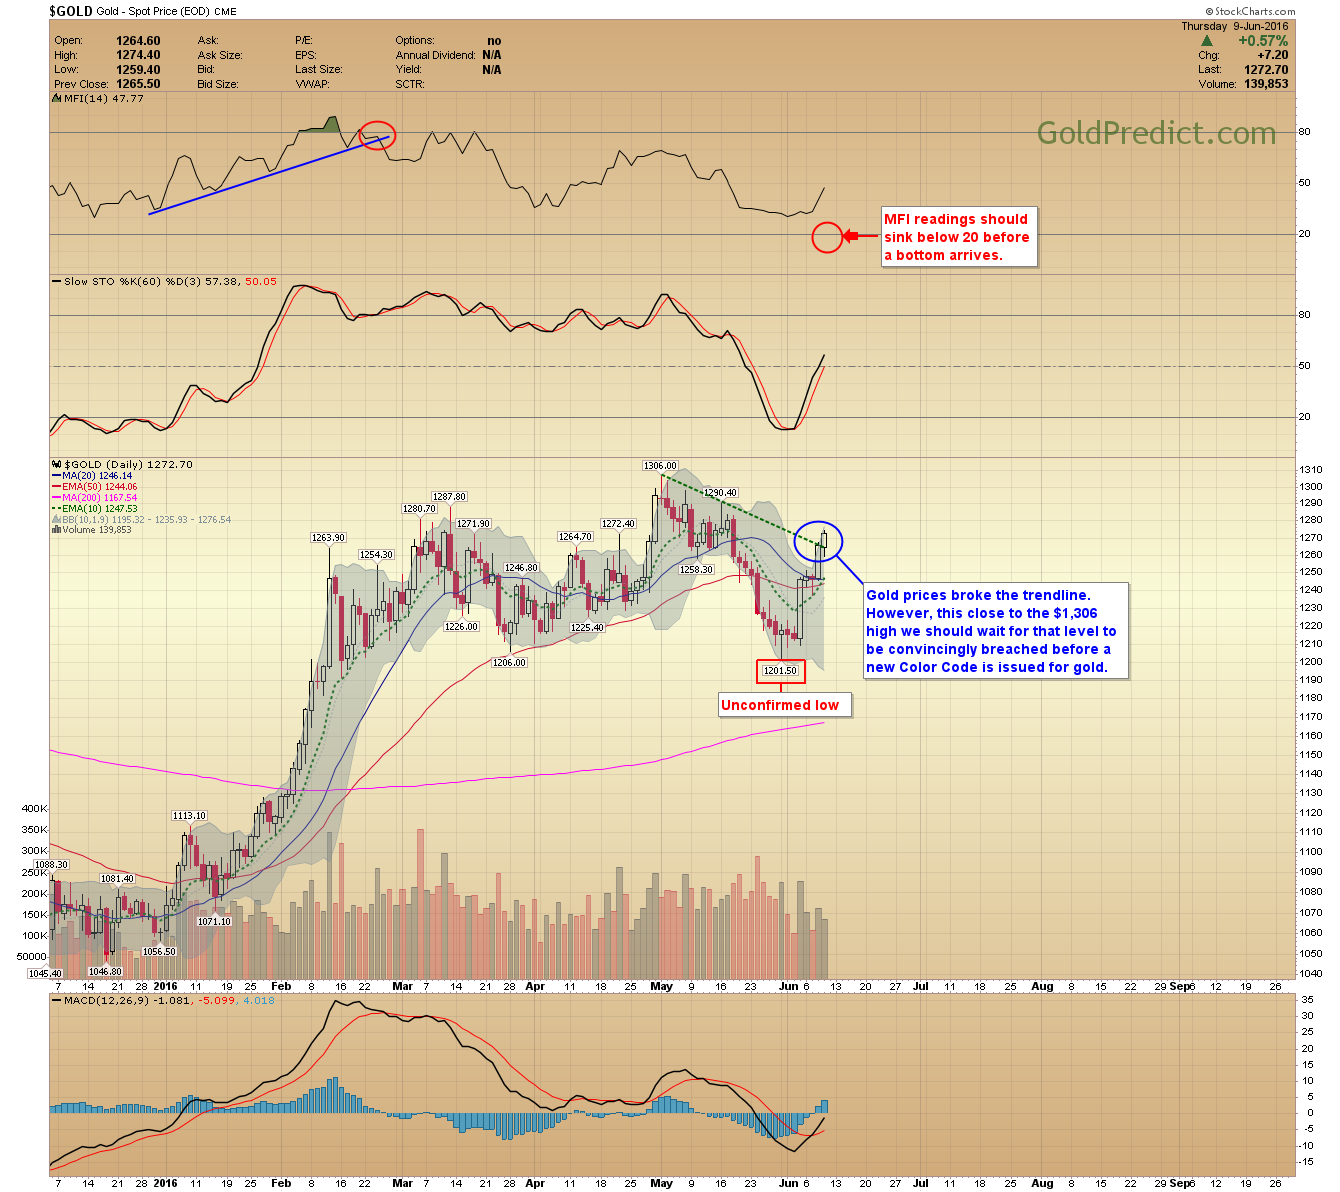
Gold Daily Chart


-SILVER- Silver is behaving like it put in a 6-month cycle low but I’m not entirely convinced, just yet.
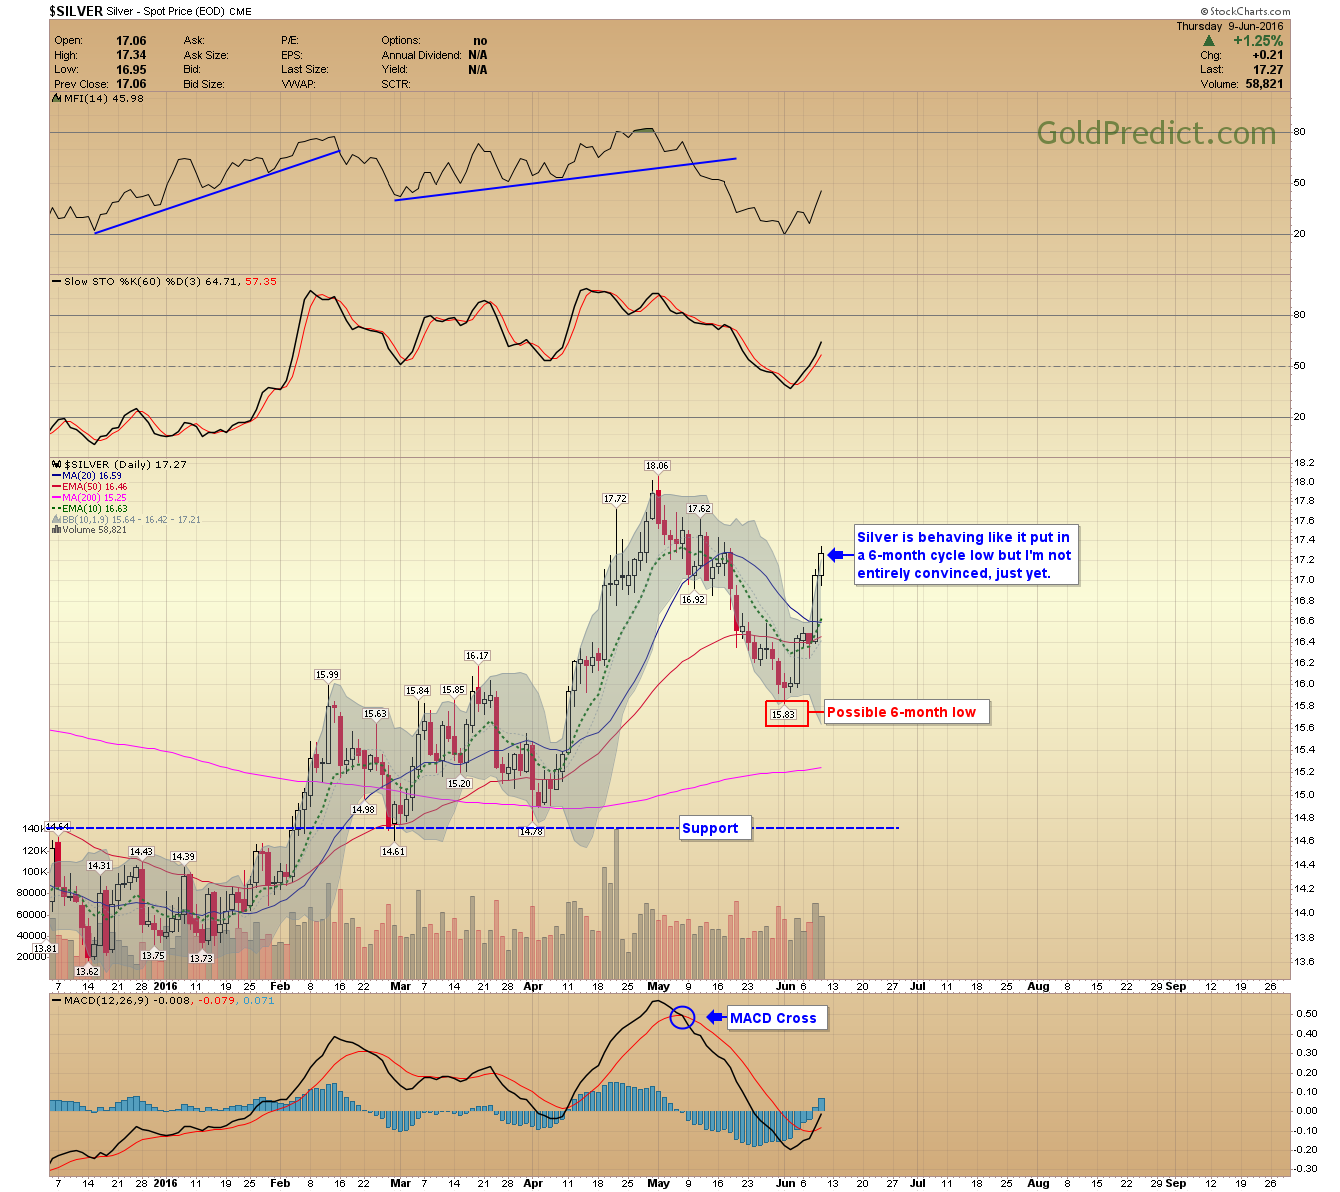

Silver Daily Chart

-HUI- If 196.75 is the 6-month low, it was the shallowest intermediate-term correction I can remember. The Same potential breakaway gap exists in the HUI; if prices drop below 227 then there will be a quick trip lower into the real 6-month low. Note: Slow Stochastics (top) is already back in overbought territory, only 7-days into a new 6-month cycle? Seems very unlikely! I’m having trouble believing this is the case.
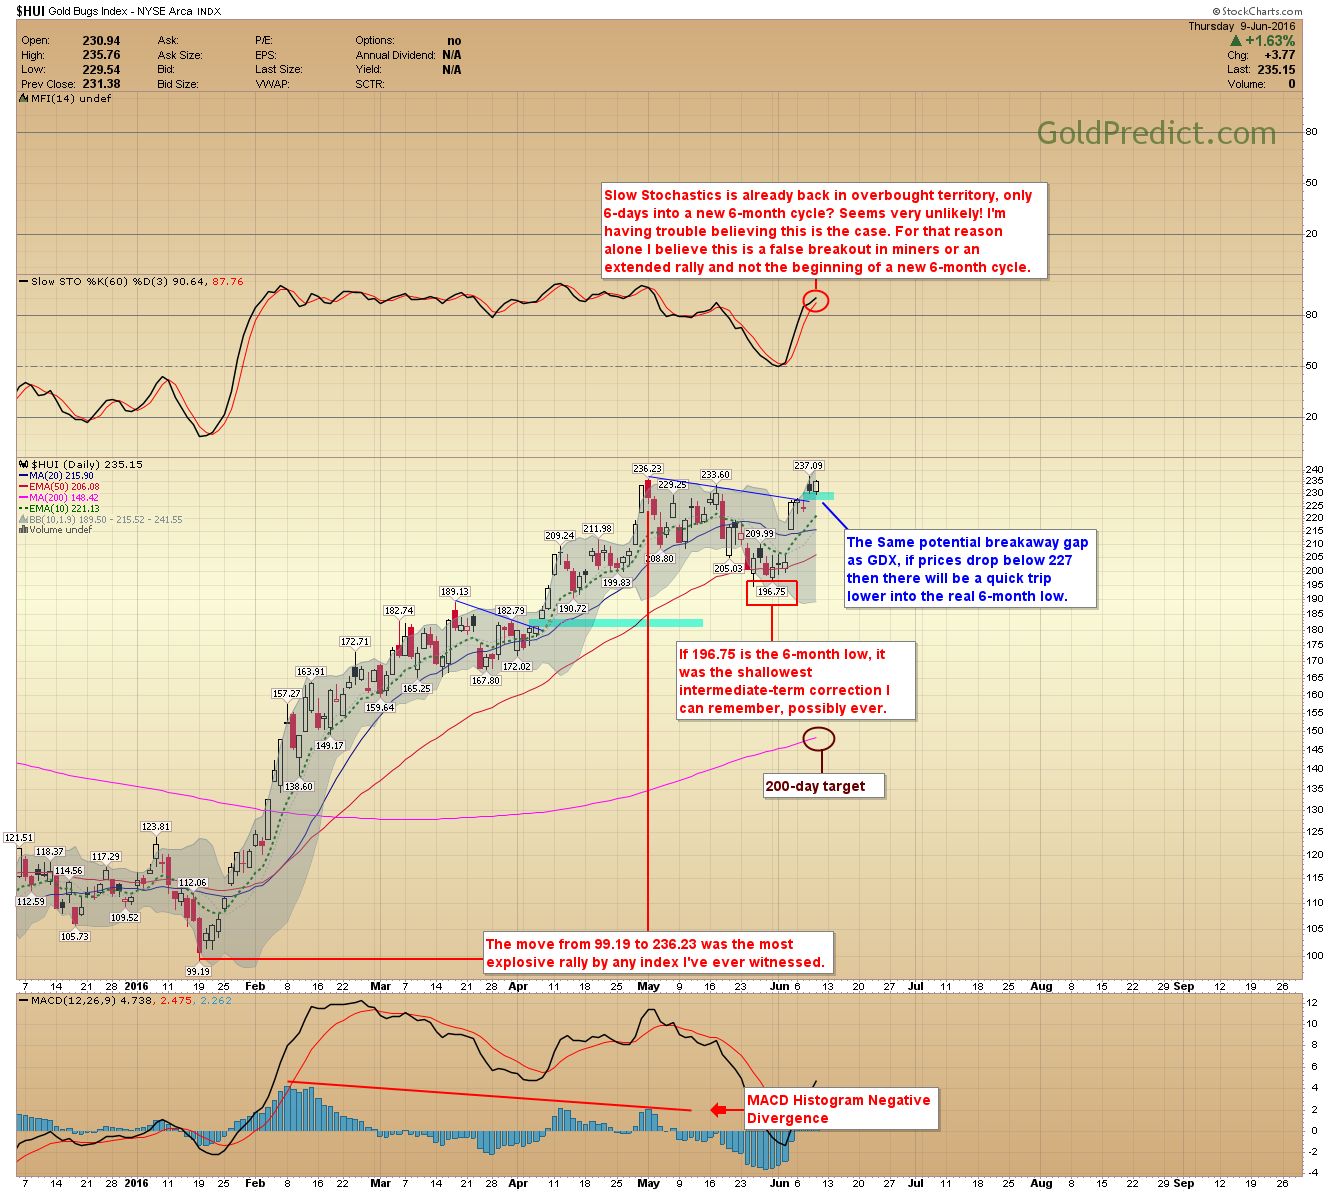
HUI Daily Chart

-GDXJ- A close below $39.00 in VanEck Vectors Junior Gold Miners (NYSE:GDXJ) would close the potential breakout gap.
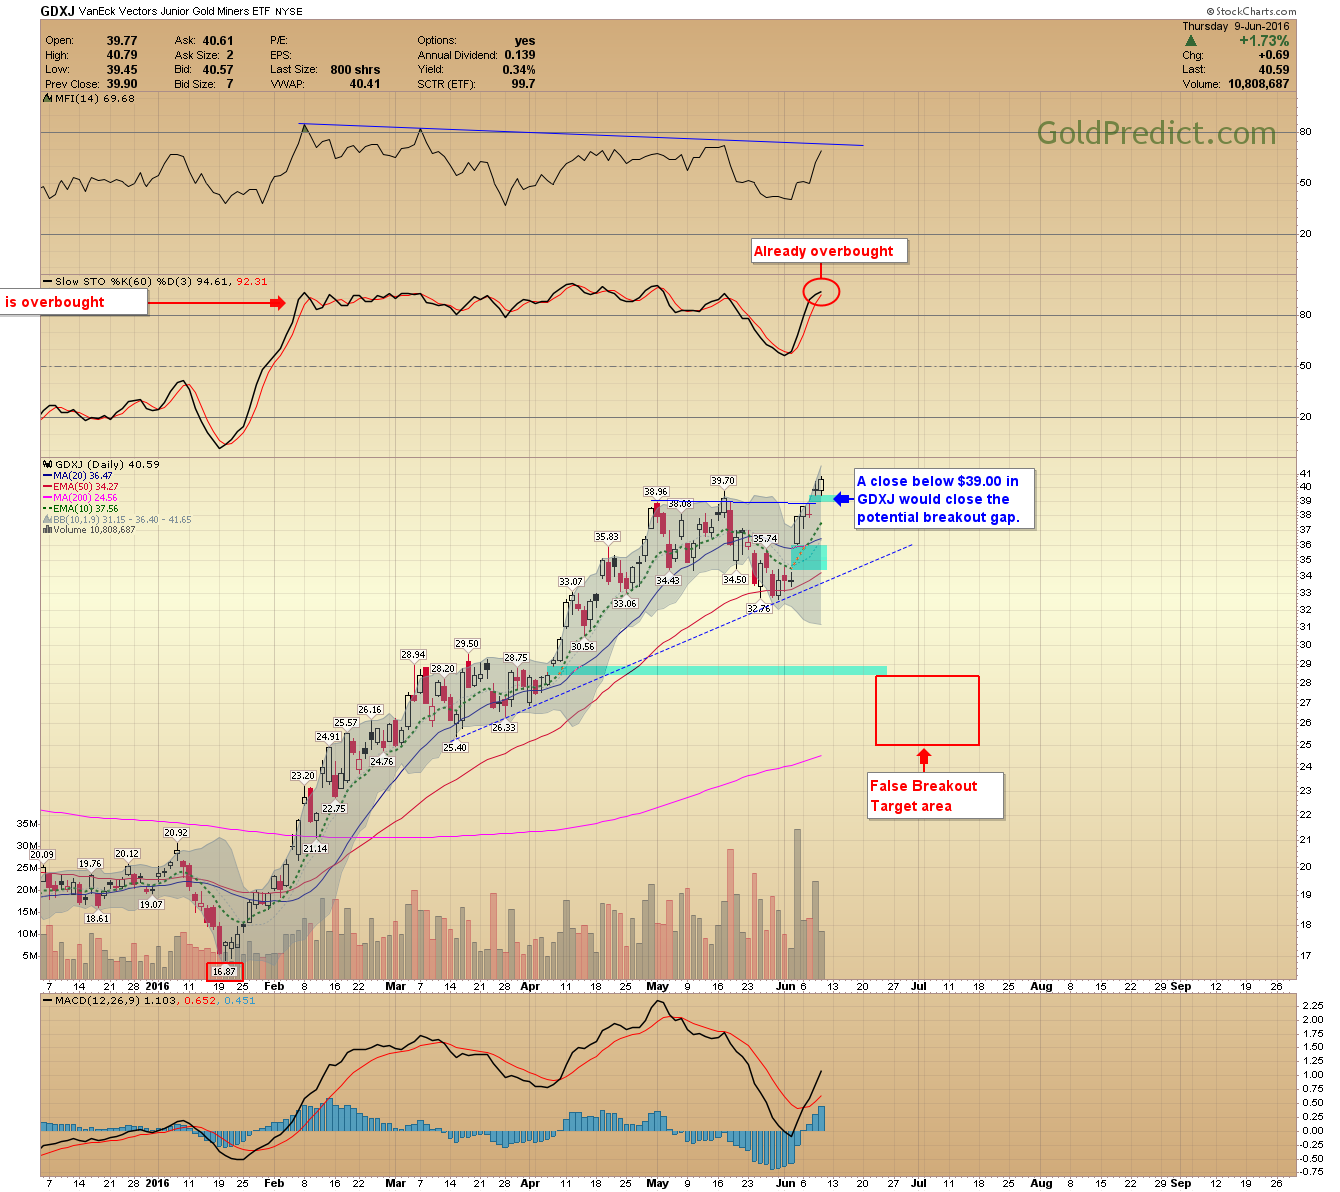
GDXJ Daily Chart

-WTIC- Oil touched the $51.00 minimum target, and prices could rise a little further. A close below the ascending wedge pattern will signal the top and prices should drop toward the target below.
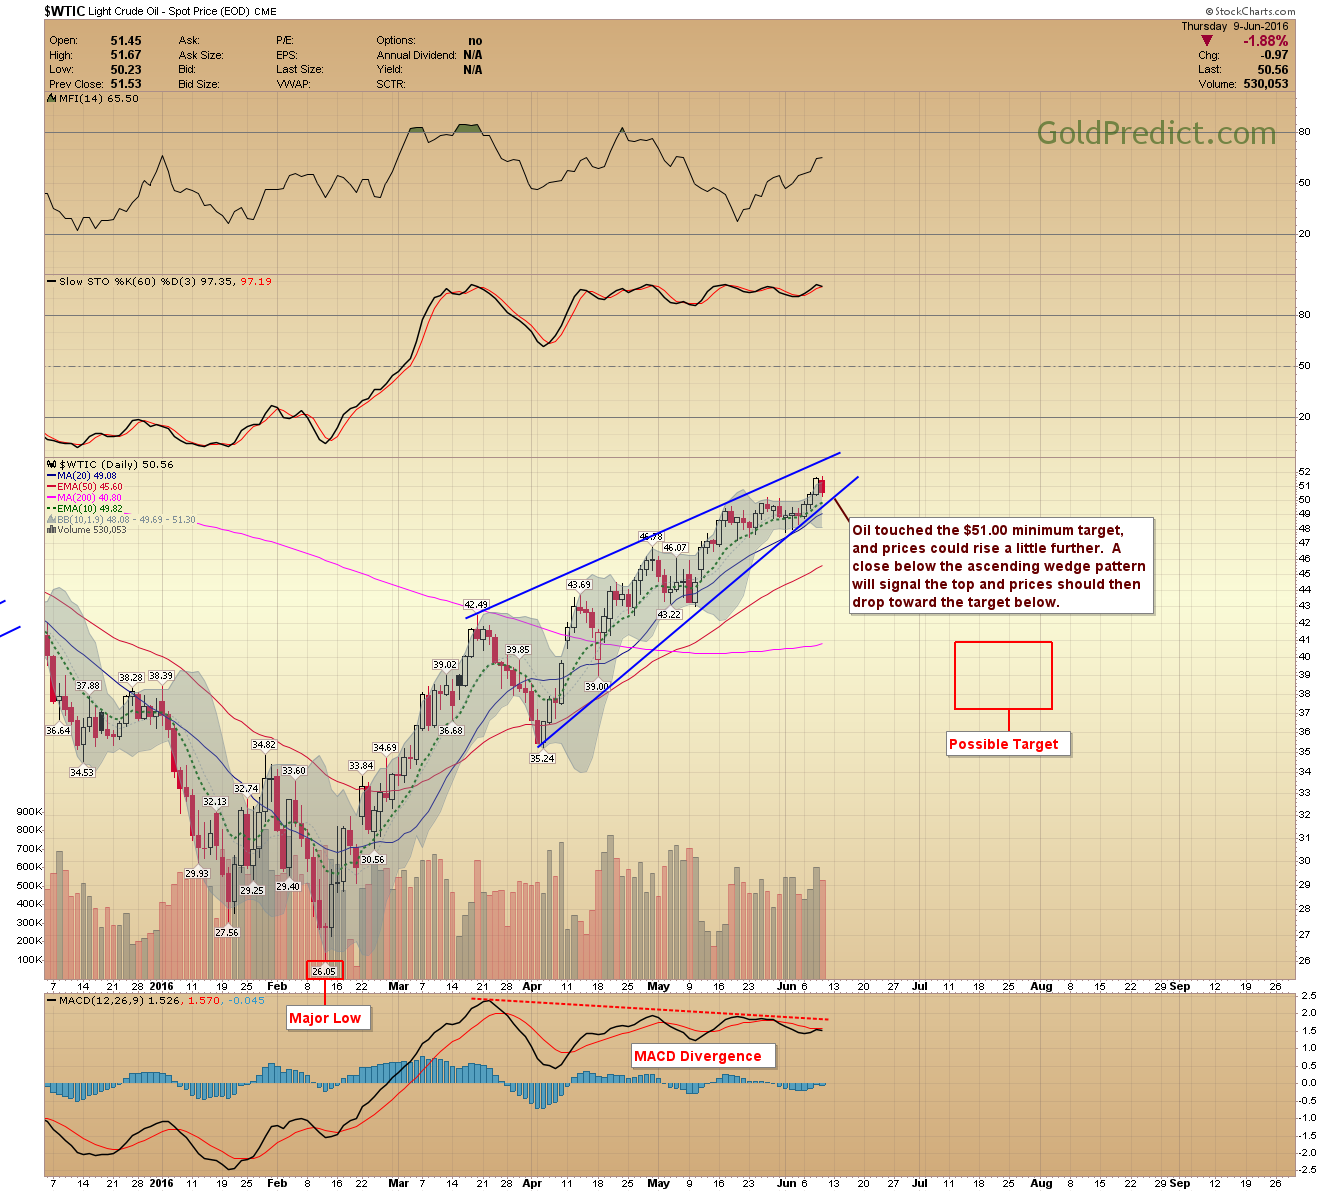
WTIC Daily Chart

Have a good weekend!

Latest comments

Loading next article…
Risk Disclosure: Trading in financial instruments and/or cryptocurrencies involves high risks including the risk of losing some, or all, of your investment amount, and may not be suitable for all investors. Prices of cryptocurrencies are extremely volatile and may be affected by external factors such as financial, regulatory or political events. Trading on margin increases the financial risks.
Before deciding to trade in financial instrument or cryptocurrencies you should be fully informed of the risks and costs associated with trading the financial markets, carefully consider your investment objectives, level of experience, and risk appetite, and seek professional advice where needed.
Fusion Media would like to remind you that the data contained in this website is not necessarily real-time nor accurate. The data and prices on the website are not necessarily provided by any market or exchange, but may be provided by market makers, and so prices may not be accurate and may differ from the actual price at any given market, meaning prices are indicative and not appropriate for trading purposes. Fusion Media and any provider of the data contained in this website will not accept liability for any loss or damage as a result of your trading, or your reliance on the information contained within this website.
It is prohibited to use, store, reproduce, display, modify, transmit or distribute the data contained in this website without the explicit prior written permission of Fusion Media and/or the data provider. All intellectual property rights are reserved by the providers and/or the exchange providing the data contained in this website.
Fusion Media may be compensated by the advertisers that appear on the website, based on your interaction with the advertisements or advertisers.
© 2007-2024 - Fusion Media Limited. All Rights Reserved.