The linear uptrend in stocks this quarter, which has only recently stuttered for a week or two around S&P 1400, has lifted that index at a 46% annualized pace (11.58% for the quarter-to-date). It seems unlikely that the last day of the quarter will see a further rally just because of ‘window-dressing’ (or the more-slimy tradition in which hedge funds push up thinly-traded names to get better marks for the quarter), but it may well see a further rally because, well, it’s just another day of easy money and few compelling investment alternatives.
Oddly, that same argument works much better for commodities, which tend to have a high inflation ‘beta’ and have historically had strong performances when real interest rates are low (as they are now), and yet after today’s agriculture and energy-led selloff the DJ-UBS commodity index is actually -0.52% on the year. The forward performance gulf continues to grow, while those of us who have favored hard commodities over soft hopes that equities can continue to grow to the sky are left gasping in the dust pounded up by the stampeding equity bulls.
I often look at the cyclically-adjusted P/E ratio (CAPE), which compares the inflation-adjusted price of the market (in this case, the S&P) against the 10-year average of the inflation-adjusted earnings per share. That ratio is currently at 22.4, against a long-term average of 16 (the long-term average is more like 15 if the 1999 bubble is removed). This measure echoes the indications of Tobin’s Q: they both say that the equity market is woefully overvalued not with respect to the current interest rate – comparing to see which bubble is less, and going long that bubble, doesn’t seem a winning strategy to me – but with respect to historical cycles of value.
However, I believe in questioning assumptions so I recently began to wonder whether the fact that we have had two deep recessions in the last ten years might have biased this number higher; if so, then as the first of those recessions rolls out of the 10-year window the CAPE ought to slip gently back to earth without a price effect, and the market might arguably not be as overvalued as this indicator suggests.
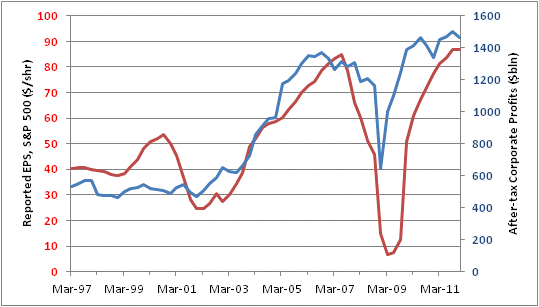
While the recession of the early 1990s did not cause a big decline in after-tax earnings according to the Federal Reserve’s Flow-of-Funds report, it did cause something of a dip in reported earnings per share (see Chart), and this is what the CAPE calculation uses. So, there is at least some argument to be made that CAPE may be exaggerated a little bit because it includes two sizeable recessions, when a normal 10-year window is unlikely to have more than one.
The counter-argument, though, ought to be considered. The counter-argument would be that looking at reported earnings, whose quality has probably never been worse (more manipulated) in history, is a convenient measure but perhaps not the best measure. It could be argued that the profits measure from the flow-of-funds report would make more sense.
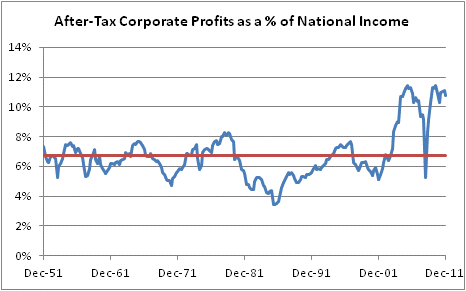
I am not here to propagate that argument, but while I have the data for corporate profits out you should consider another argument from the bears. Investors who feel the stock market is likely to perform poorly in the future (among them the august Jeremy Grantham) point out that the level of profits as a share of national income is near extreme levels (see Chart).
So, investors who expect good returns from stocks going forward need to have one of these things happen: (1) profits as a share of national income stay near record levels, or (2) a rise in national income, rather than a fall in profits, causes the reversion to the mean. I suppose it could also happen that profits fall, but P/E ratios rise; this, however, seems to me to be wistful thinking akin to assuming that “prices will stay high somehow.” Personally, it doesn’t appear that the populism sweeping the nation in the form of the “99%” supposedly represented by the Occupy Wall Street crowd, the “Buffett taxers”, and other phenomena represent fertile soil for continued robust corporate profits in the face of weak personal income growth.
There is also the possibility that the recession that is rolling out of the 10-year data window could be replaced by another recession. So far, there is no sign of that, but it also appears that the strong recent data may owe some credit to the warm winter weather in January and February. Today’s Initial Claims (359k) was the lowest in a long time, but only because the lower figures in February were revised sharply higher in a benchmark revision process. The labor market seems to still be improving, but it doesn’t look like the engine has fully caught yet.
For my part, I remain leery of both stocks and TIPS and am actively avoiding (or shorting) nominal bonds. I see commodity indices as the only undervalued asset class. While they will surely get pummeled unfairly if nominal growth slows, the fundamentals for commodity price increases remain in place, and I remain heavily committed to that market.
- English (UK)
- English (India)
- English (Canada)
- English (Australia)
- English (South Africa)
- English (Philippines)
- English (Nigeria)
- Deutsch
- Español (España)
- Español (México)
- Français
- Italiano
- Nederlands
- Português (Portugal)
- Polski
- Português (Brasil)
- Русский
- Türkçe
- العربية
- Ελληνικά
- Svenska
- Suomi
- עברית
- 日本語
- 한국어
- 简体中文
- 繁體中文
- Bahasa Indonesia
- Bahasa Melayu
- ไทย
- Tiếng Việt
- हिंदी
Don’t Surrender The CAPE
Published 03/30/2012, 03:48 AM
Updated 02/22/2024, 09:00 AM
Don’t Surrender The CAPE
Latest comments
Loading next article…
Install Our App
Risk Disclosure: Trading in financial instruments and/or cryptocurrencies involves high risks including the risk of losing some, or all, of your investment amount, and may not be suitable for all investors. Prices of cryptocurrencies are extremely volatile and may be affected by external factors such as financial, regulatory or political events. Trading on margin increases the financial risks.
Before deciding to trade in financial instrument or cryptocurrencies you should be fully informed of the risks and costs associated with trading the financial markets, carefully consider your investment objectives, level of experience, and risk appetite, and seek professional advice where needed.
Fusion Media would like to remind you that the data contained in this website is not necessarily real-time nor accurate. The data and prices on the website are not necessarily provided by any market or exchange, but may be provided by market makers, and so prices may not be accurate and may differ from the actual price at any given market, meaning prices are indicative and not appropriate for trading purposes. Fusion Media and any provider of the data contained in this website will not accept liability for any loss or damage as a result of your trading, or your reliance on the information contained within this website.
It is prohibited to use, store, reproduce, display, modify, transmit or distribute the data contained in this website without the explicit prior written permission of Fusion Media and/or the data provider. All intellectual property rights are reserved by the providers and/or the exchange providing the data contained in this website.
Fusion Media may be compensated by the advertisers that appear on the website, based on your interaction with the advertisements or advertisers.
© 2007-2024 - Fusion Media Limited. All Rights Reserved.
