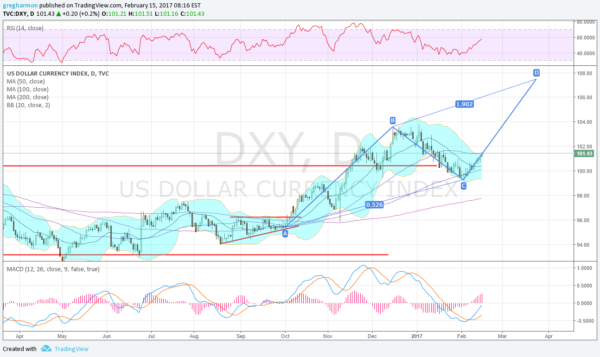
The US Dollar Index broke above a 2 year range following the election in November. It staggered and came back to retest the break out in the first days of December. but then turned around and marched higher. But as the calendar turned to 2017 the index started to fall back again. The pullback lasted all of January until it found a bottom at the 100 day SMA. Since the start of February it has been moving higher again. Will it continue to show strength? Several signs point to yes.
The chart below tells the story. First there is the price rising back over the break out level. It starts Wednesday at its 50 day SMA as a possible brake. But it is confirming an AB=CD pattern that gives a target above to 107.40. That would be a real show of strength. There is resistance at 102 and 103 recently and then 104 and 106 from several years ago.

Next, as it is pushing back higher it has reached the Upper Bollinger Band®. These had squeezed in. But instead of holding and blocking a move up, the Bollinger bands are opening to the upside to allow it to move higher. Momentum also supports continued upward price action. The RSI is rising and bullish, about to cross 60. The MACD crossed up at the beginning of the month and is rising, almost into positive territory. All of these support continued strength in the greenback.
The information in this blog post represents my own opinions and does not contain a recommendation for any particular security or investment. I or my affiliates may hold positions or other interests in securities mentioned in the Blog, please see my Disclaimer page for my full disclaimer.
