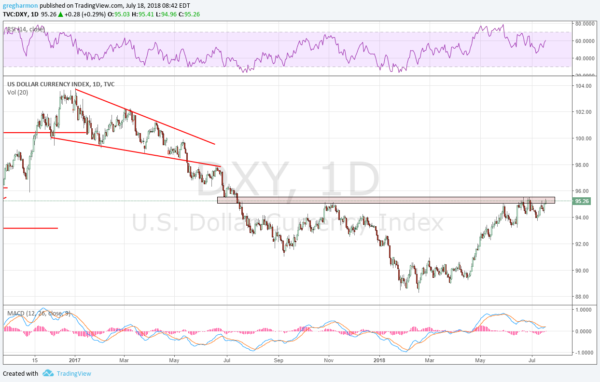
The US Dollar Index has had bumpy path since the last Presidential election. There was an initial spike that brought it up over 6% in the first 6 weeks. But then it started moving lower, at first in a falling wedge. It broke the wedge to the downside in May 2017 as it had retraced the entire move up. A retest if the wedge came in June last year before it accelerated to the downside.
It looked like the all-clear signal might have sounded in September 2017 but then after a 2 month run higher it stalled at 95. Another pullback took it to a bottom in January and it held there until late April. That is when the US Dollar Index started to move higher again. Since the first move higher that stopped right at 95, it has now bounced off of the area from 95 to 95.50 four times. Looking left this range has been resistance 5 times and support once over the last 13 months, an important area. Will the US Dollar break through this time?

There is evidence building that the Dollar is strengthening as it keeps hitting its head. Momentum has reset lower from a peak in early May when it was overbought. The RSI was up near 80 at the time and then worked its way back to 45 without much movement in the Dollar Index. Now it is moving back higher again. The MACD worked from a 18 month peak back to near zero but is now crossing up and remains positive.
A Technician can look at the price action several ways, and since late June 2017 they could read an Inverse Head and Shoulders pattern about to trigger. Or they could also see a move from a base at 90 to consolidation at 95, with a potential second move above. Both views would give a target to at least 100. A move over 95.50 would give confirmation.
The information in this blog post represents my own opinions and does not contain a recommendation for any particular security or investment. I or my affiliates may hold positions or other interests in securities mentioned in the Blog, please see my Disclaimer page for my full disclaimer.
