
The dollar weakened against most currencies as Eurozone indicators showed no new signs of weakness and US indicators showed no new signs of strength. Press reports played down the likelihood of ECB action this week and argued that December seemed to be a more reasonable time to expect a refi action, something I agree with. As a result expectations of ECB action on Thursday faded somewhat, while expectations of early Fed action faded somewhat as well. The result was a lower dollar and a stronger euro.
The European purchasing managers’ indices showed modest growth and nothing dramatic enough to warrant immediate action by the ECB. Export-oriented economies did the best: Germany remained the linchpin of the ECB, with its final manufacturing PMI coming in above expectations, while Spain had the strongest reading since March 2011. But Italy and France lost momentum somewhat. On the other hand, US factory orders showed some weakness: orders for capital goods sank more than previously estimated in September, with new orders of non-military capital goods other than aircraft, an indicator of business spending plans, falling 1.3% mom in Sept after a 1.0% rise in August. The disappointing durable goods figure was followed by a somewhat gentler tone from the Fed. Governor Powell said policy is “likely to remain highly accommodative for some time” and that the timing of the start of tapering is “necessarily uncertain” as it depends on the economy. I still expect the USD to remain well bid but it could retrace some of its recent sudden gains.
Although USD lost ground against most currencies, it gained somewhat vs AUD after the Reserve Bank of Australia left its benchmark interest rate unchanged (as was unanimously expected) and Gov. Stevens said that the currency remained “uncomfortably high.” The central bank seems focused on the currency, but as there are little expectations of another rate cut any time soon, the authorities are resorting to jawboning. Expect more such comments if the AUD tries to strengthen further. This should prevent AUD outperformance; the other commodity currencies look like a better investment. AUD/CAD and AUD/NZD have started to move lower; those trends seem likely to continue.
Sterling strengthened after the Confederation of British Industry (CBI) revised up its forecast for the country's growth and the construction PMI rose to 59.4 (vs an expected fall to 58.7; 58.9 previous). Investors wanting to avoid the to-and-fro of the EUR/USD trade might want to look at GBP/JPY, which has come down in the past few days; this pair seems to have more fundamental underpinning and could see some gains.
For today, the focus of attention will be on ECB President Mario Draghi who speaks in Frankfurt ahead of Thursday’s ECB rate decision. ECB’s Constancio and ECB’s Asmussen also speak again; they talked on Monday too. In the US, the Fed’s Lacker speaks on labor market in North Carolina, while Fed’s William speaks to reporters in San Francisco. As for indicators, Swiss CPI for October is expected to increase 0.1% mom, a slowdown from +0.3% mom in September. Approximately an hour later UK services PMI for October is forecast to fall to 60.0 from 60.3 but such a modest decline from such a high level is not likely to affect the pound. In the US, the service-sector ISM for October will be released. It’s usually not as market-affecting as the manufacturing index, but it is important. Forecasts are that it falls to 54.0 from 54.4.
The Market
EUR/USD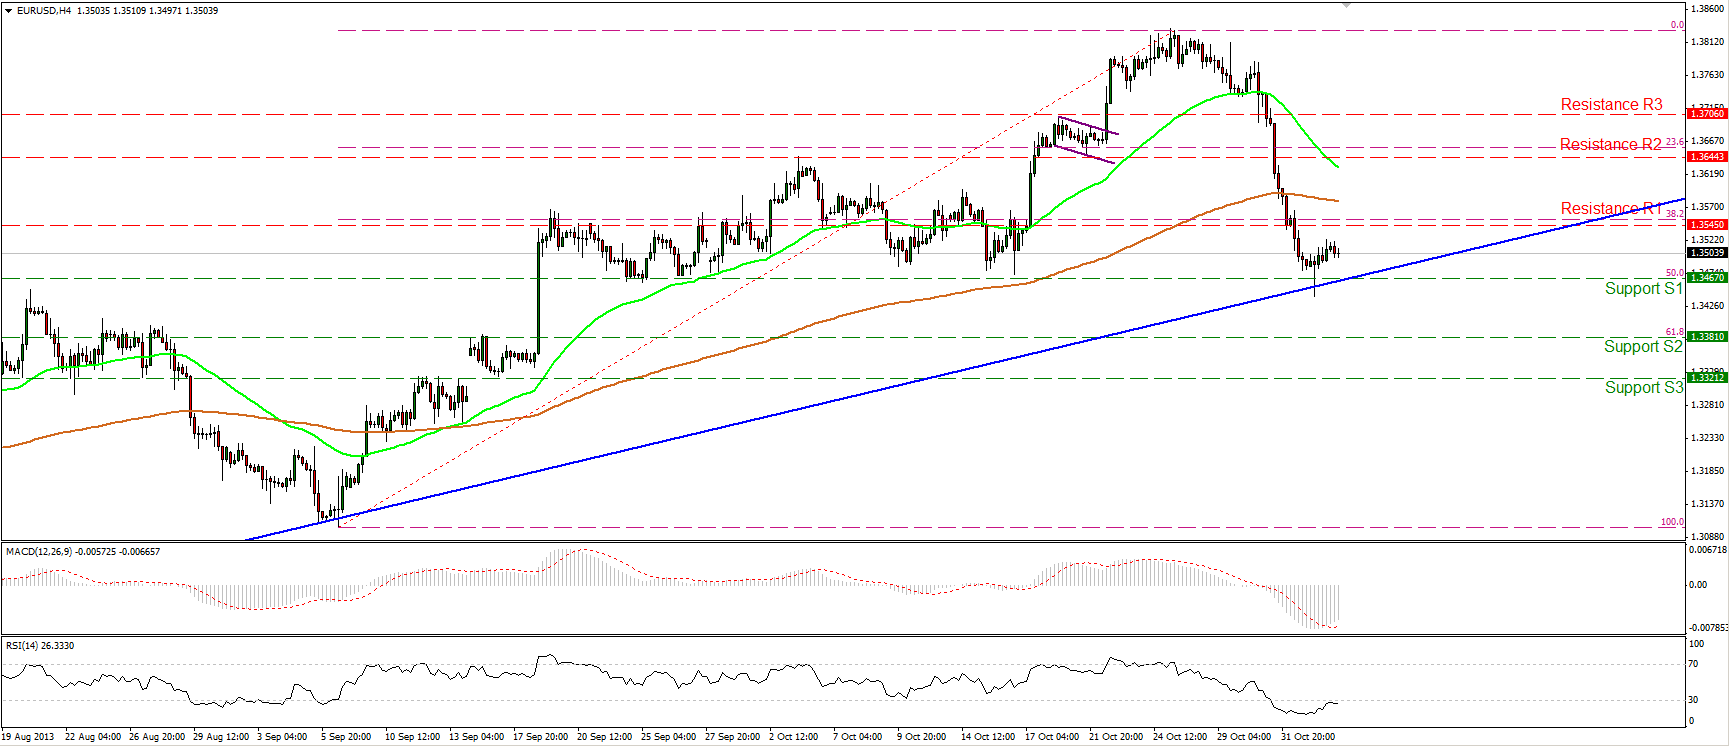 EUR/USD Hourly Chart" title="EUR/USD Hourly Chart" width="1729" height="747">
The EUR/USD moved slightly higher after finding support near the 50% Fibonacci retracement level of the Sept 6th – Oct 25th advance and the longer-term uptrend line. If the bulls manage to drive the rate above the 1.3545 (R1) barrier, then I would consider the recent fall as a retracement of the overall uptrend and expect that the pair has returned to its previous direction. On the other hand, a downward penetration below that support area might extend the bearish wave towards the 61.8% Fibonacci retracement level at 1.3381 (S2). On the daily chart the long term uptrend remains in effect since the rate is still trading above the uptrend line.
• Support: 1.3467 (S1), 1.3381 (S2), 1.3321(S3)
• Resistance: 1.3545 (R1), 1.3644 (R2), 1.3706 (R3).
USD/JPY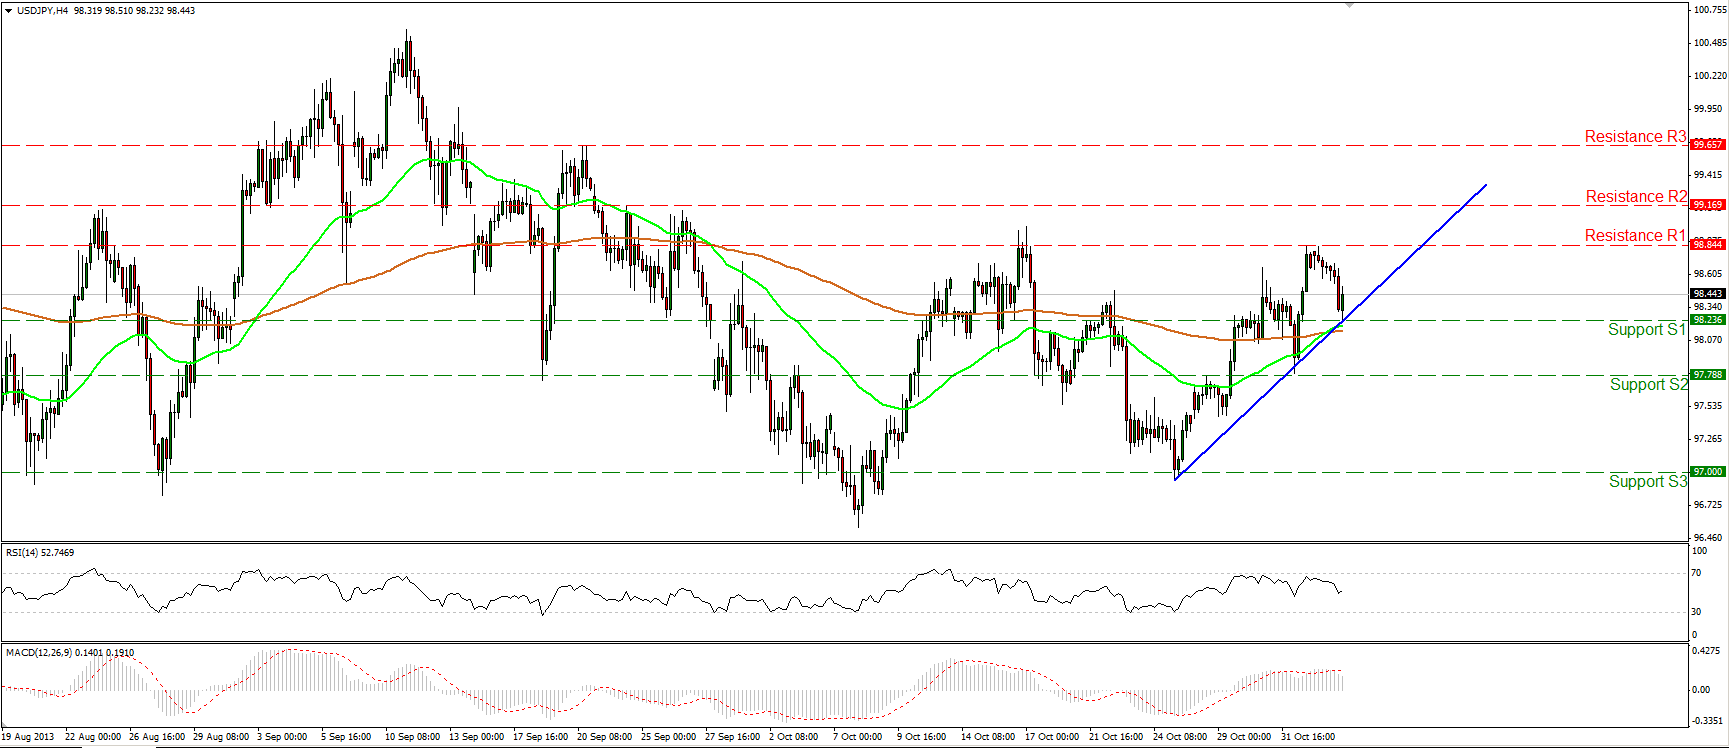 USD/JPY Hourly Chart" title="USD/JPY Hourly Chart" width="1729" height="747">
USD/JPY hit the 98.23 (S1) support level and the blue uptrend line and moved higher. If the longs manage to maintain the rate above the trend line, I expect them to challenge once more the 98.84 (R1) resistance barrier. The 50-period moving average crossed above the 200-period moving average, confirming the establishment of the new short-term uptrend. On the daily chart, a symmetrical triangle is identified, where the clear exit of the formation would indicate the next longer-term direction for the pair.
• Support: 98.23 (S1), 97.78 (S2), 97.00 (S3).
• Resistance: 98.84 (R1), 99.17 (R2), 99.65 (R3).
EUR/GBP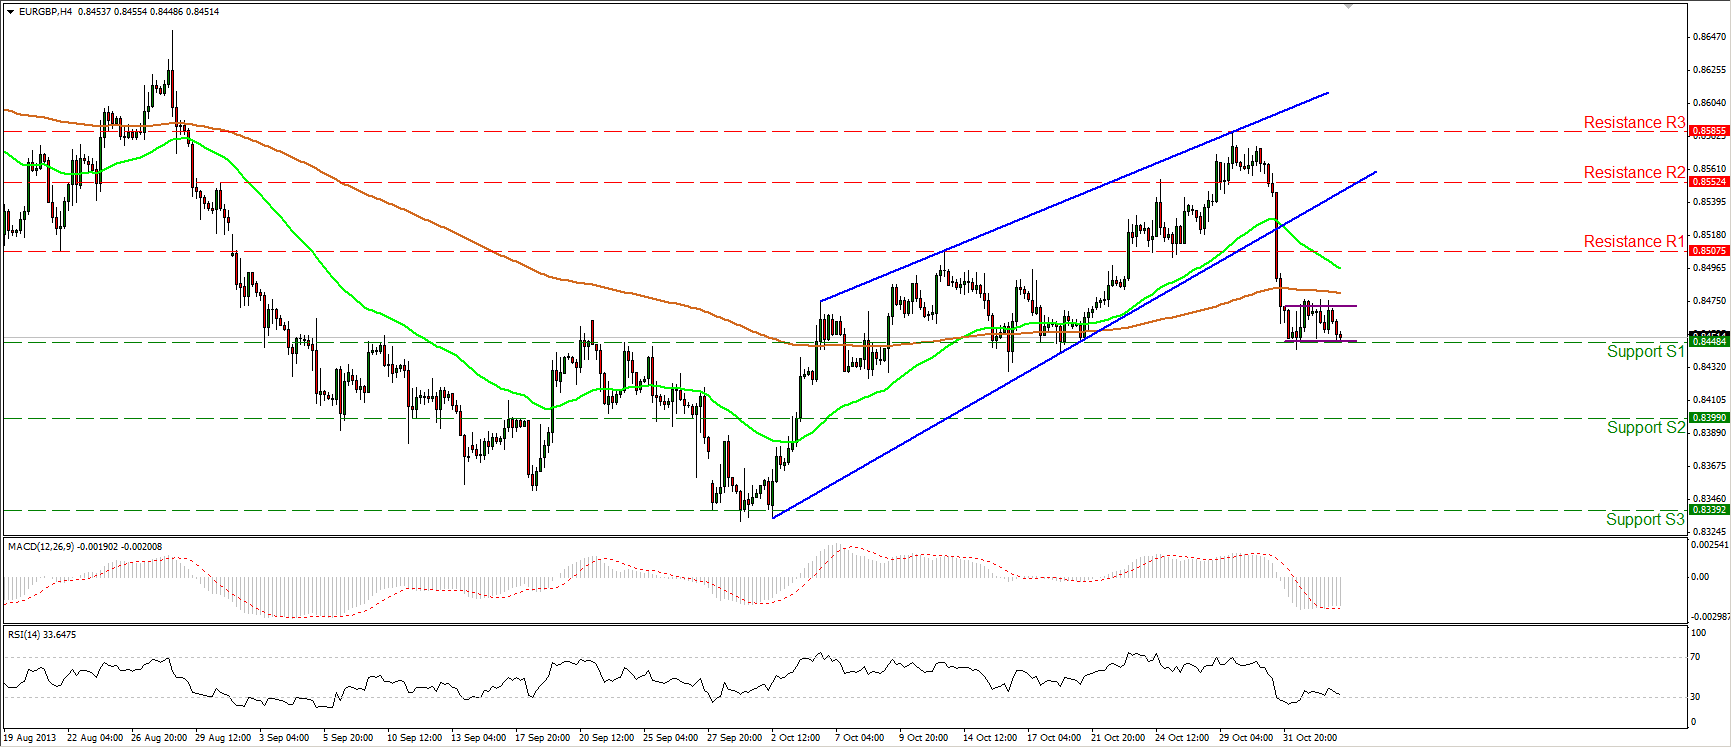 EUR/GBP Hourly Chart" title="EUR/GBP Hourly Chart" width="1729" height="747">
The EUR/GBP is moving in a consolidative mood, stubbornly testing the 0.8448 (S1) support. I believe that a decisive break below that level would confirm that the consolidation is a rectangle continuation pattern and I would expect extensions towards the next support barrier at 0.8399 (S2). The rate is trading below both moving averages, while the MACD lies in its negative zone, favoring further decline.
• Support: 0.8448 (S1), 0.8399 (S2), 0.8339 (S3).
• Resistance: 0.8507 (R1), 0.8552 (R2) and 0.8585 (R3).
Gold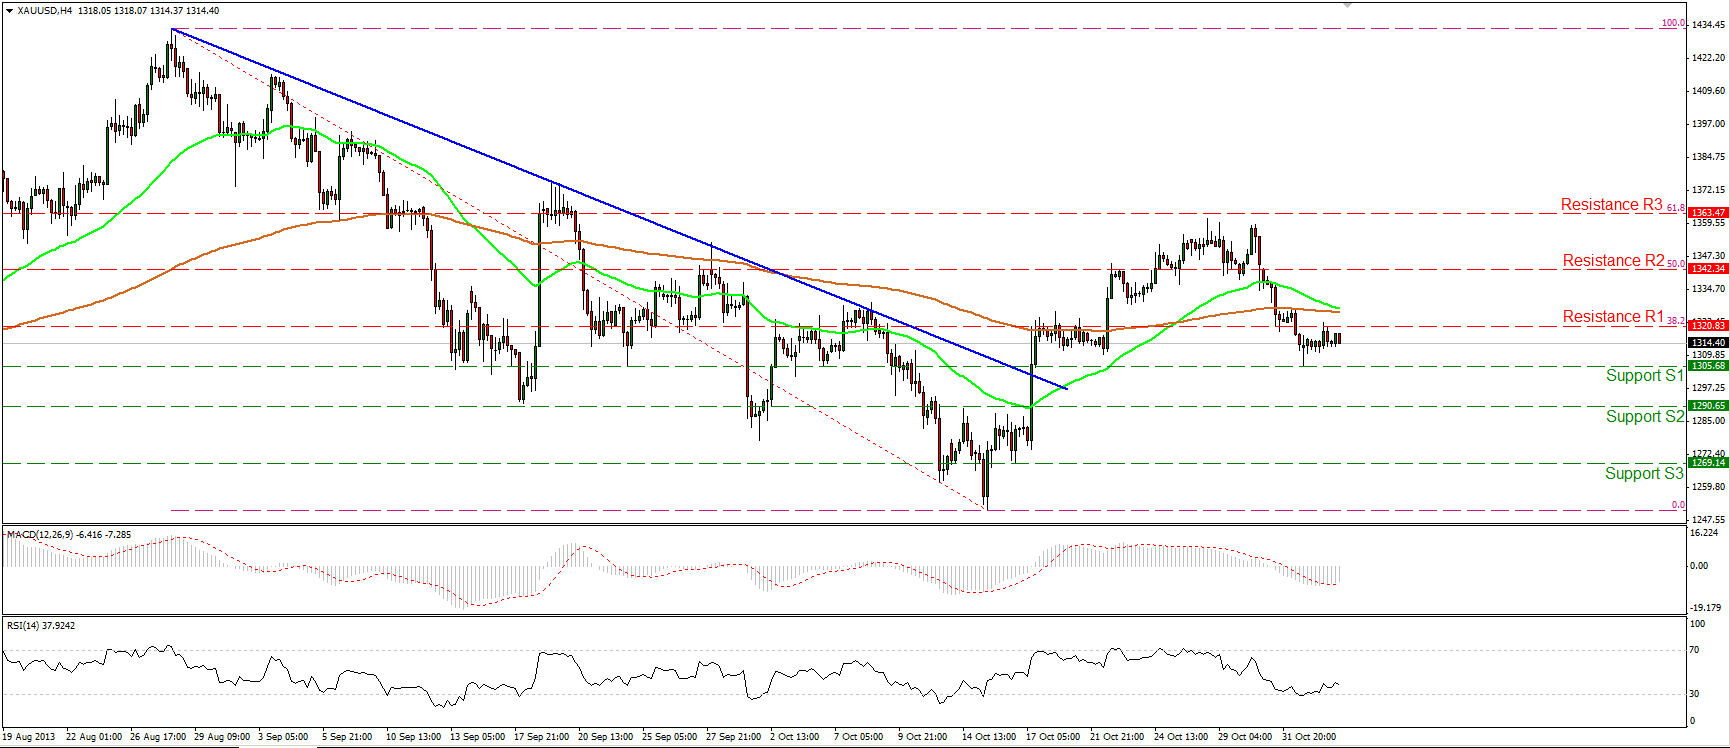 XAU/USD Hourly Chart" title="XAU/USD Hourly Chart" width="1729" height="747">
Gold moved sideways, remaining between the 1305 (S1) support level and the resistance of 1320 (R1). A clear downward violation of the 1305 (S1) barrier would have larger bearish implications and would confirm my suspicions that the recent advance was just a 61.8% retracement of the prior downtrend (marked with the blue downtrend line). However, the RSI rebounded from its 30 level and further consolidation or an upward wave in the price during the day would not surprise me.
• Support: 1305 (S1), 1290 (S2), 1269 (S3).
• Resistance: 1320 (R1), 1342 (R2), 1363 (R3).
Oil
WTI also moved sideways, remaining near the lower boundary of the downward sloping channel. I would expect a short-term upward wave within the channel, since the RSI seems ready to exit its oversold zone and the MACD, although in its negative territory, is ready to cross above its trigger line. The overall trend of WTI remains a downtrend since the price is trading within the blue downward sloping channel and the 50-period moving average remains below the 200-period moving average.
• Support: 93.61 (S1), 91.22 (S2), 89.32 (S3).
• Resistance: 96.00 (R1), 98.81 (R2), 101.00 (R3).
BENCHMARK CURRENCY RATES - DAILY GAINERS AND LOSERS
MARKETS SUMMARY