The US Dollar Index is following a bearish trend and has convincingly rejected off it. This presents us with an opportunity to follow the Dollar lower.
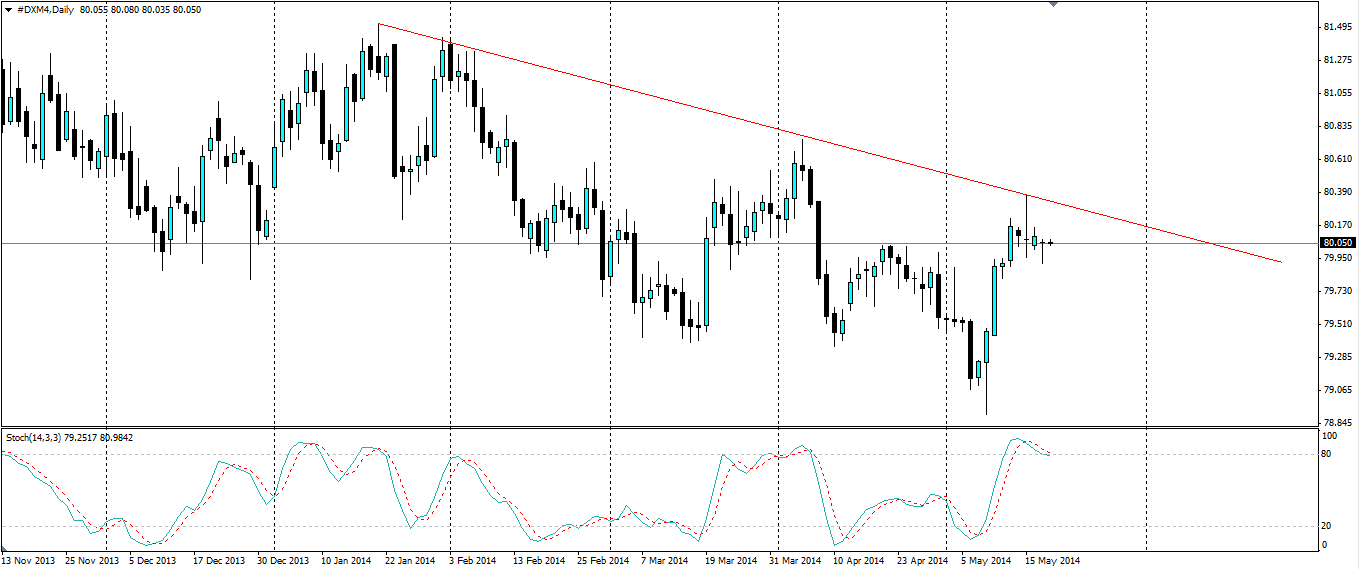
The Dollar index has taken a liking to a bearish trend in the past few months, having tested it several times and when it hit a low on 8th May, it quickly pulled back towards the line. Once again, it was tested and as we can see on the chart below, there was a clear rejection off this line. This shows the strength of the trend line which is something we can exploit.

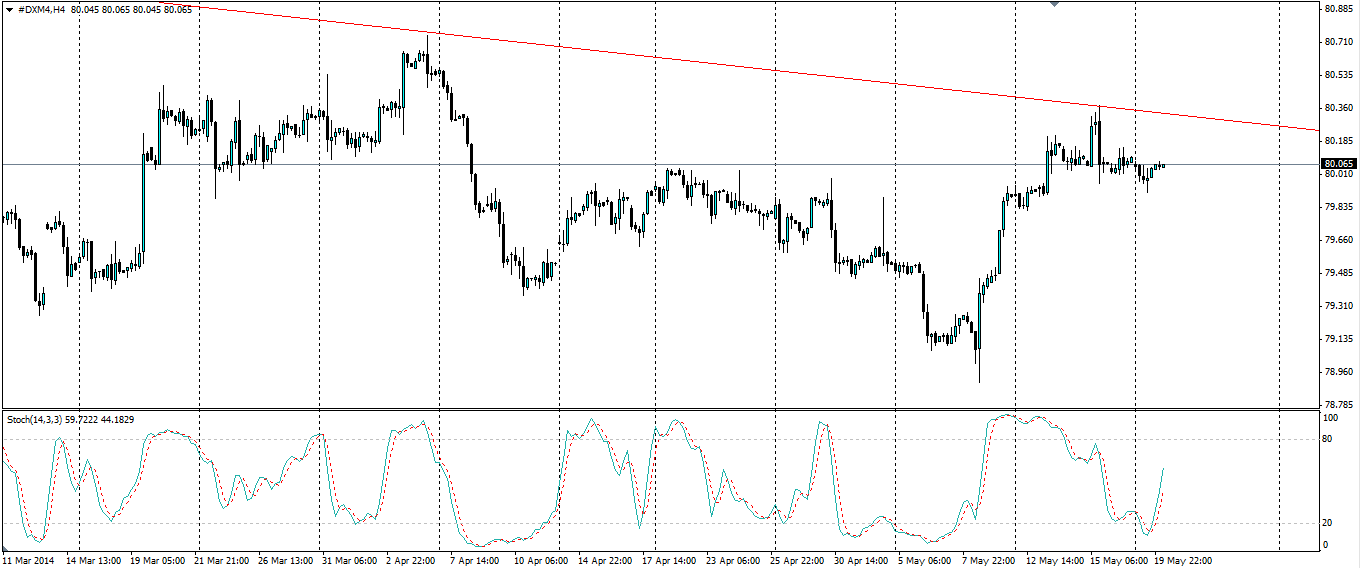
Taking a look at the above D1 chart showing us the Stochastic Oscillator, we can see the momentum has swung and is heading back down in favour of the bearsand the bearish rejecting backs this up. Interestingly, however, the Stochastic Oscillator on the H4 chart shows us that the momentum is gearing up to test the trend line again before heading down. This gives us the potential to set a trade with a tighter stop loss and a larger reward profile.

There are some upcoming events in the news we need to be wary of because they have the potential to move the market. Various FED members are due to speak this week, with Chairwoman Janet Yellen addressing NYU graduates. She is unlikely to announce anything drastic but it will be interesting nonetheless and could provide an insight into the thinking of the FED when it comes to US interest rates. US Initial Jobless Claims figures could have an impact on the Dollar as it gives an indication of the health of the economy.
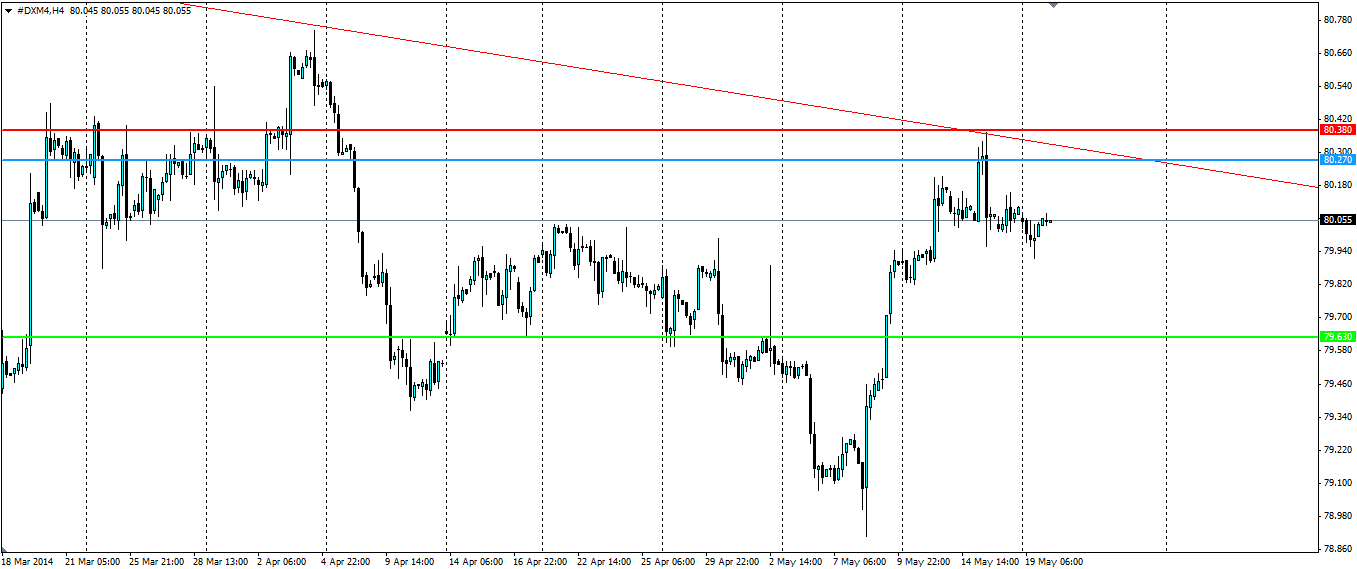
Alimit sell entry should be set just below the trend line so we can get in if the price tests it again. A stop loss should be set just above the trend line to limit our downside in case it does not hold. This set-up will get us a higher risk/reward ratio than if we were to sell at the market price or wait for the support to break. There are several potential support levels we could target but the 79.63 level looks sensible. Risk adverse traders could look to the 80.00 level as a first exit point.

The US Dollar Index has convincingly rejected off its current bearish trend line and looks set to test support at lower levels. The shorter timeframe charts show a potential second test of the trend line which could prove lucrative if correctly set up.
