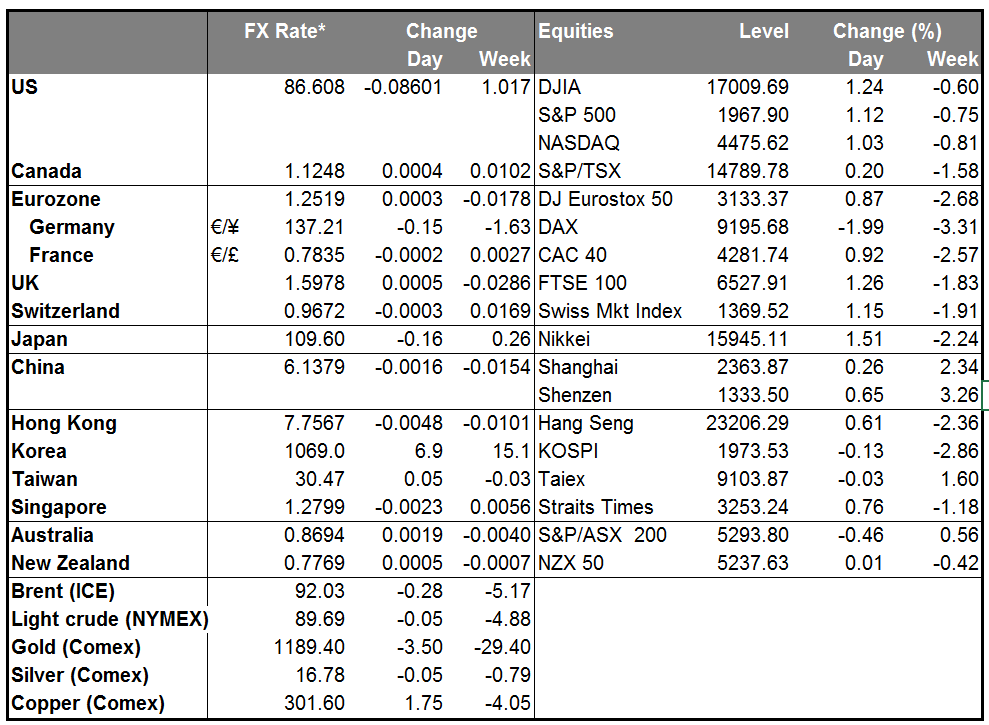
Nonfarm payrolls send USD sharply higher. The DXY dollar index, a gauge of the greenback’s value against six major currencies, surged to a four year high after the strong employment report data. Nonfarm payrolls rose a higher-than-expected 248k in September, up from a revised 180k in August and returning to above 200k readings again. The average of July, August and September was around 224k, not far off the 228k pace in the first half of the year. Year to date, the average is 227k a month, the best since 1999. The unemployment rate fell to its lowest level since June 2008, which suggests that the US recovery is on a strong track. The only weak point was the small growth in average hourly earnings and the moderate decline in the participation rate.
The overall robust labor report adds to the growing body of evidence that the US recovery is gaining momentum and should sustain the case for the Fed to raise interest rates next year. It is not a game-changer, however. The market’s implied forecast for Fed funds in 2017 rose only 3.5 bps in reaction to the data. The implied interest rates on the 2017 Fed funds futures contracts are still on average 11 bps below where they were at the recent peak of Sep. 19th. That may be because the doves on the FOMC can still find evidence in the data to back up their concerns about “significant underutilization” of labor resources. The unemployment rate is still well above the FOMC's longer run estimate of 5.2% to 5.5%, while wages are growing far below the assumed neutral rate of 3.5% (based on productivity growing 1.5% and inflation of 2%). The slow growth in wages also suggests little inflationary pressure.
Nonetheless, the DXY index has risen 2.3% over that period, suggesting that more than just Fed expectations are at work here. One aspect is probably the widening divergence between the US monetary policy outlook and that of other countries. Yet GBP/USD hit a low for the year on Friday (as did AUD/USD), demonstrating that USD is gaining even against the one other country that’s also expected to tighten rates in the not-too-distant future. It seems that there is simply strong demand for dollars.
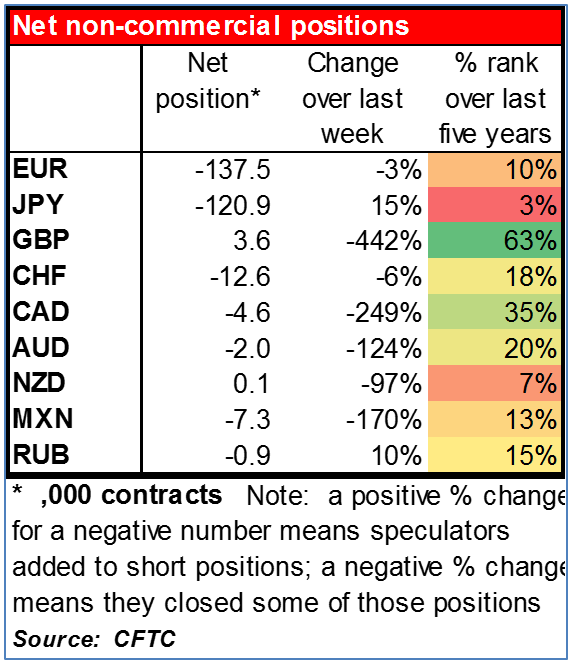
We can get a hint of where that demand is coming from by looking at the weekly Commitment of Traders (COT) report. Net non-commercial EUR shorts remained steady, as they have been since early September. Investors went long GBP ahead of the Scottish referendum and cut those positions afterwards. JPY shorts expanded notably, while shorts in other currencies, including CAD and AUD, expanded modestly. Short positions in CHF were closed back. The relatively modest increase in speculative short positions in non-dollar currencies is at variance with the large rise in the dollar. This suggests that real money investors and corporate hedging has been leading the dollar’s move upwards, which would mean it likely has much further to go.
Platinum and palladium, which fell sharply on Thursday, continued to fall on Friday. This is adding to the pressure on gold coming from the stronger dollar and thoughts of higher interest rates.
Today’s indicators: During the European day, the only indicator worth mentioning is German factory orders for August. The market consensus is for the figure to drop, a turnaround from the previous month, adding to the batch of weak data coming Germany. We have one speaker on Monday’s agenda, Riksbank Deputy Governor Per Jansson.
Rest of the week: central bank meetings As for the rest of the week, there will be three G10 central bank policy meetings: two on Tuesday and one on Thursday. Tuesday, the Reserve Bank of Australia is unanimously expected to keep rates steady. It will be interesting to see if Gov. Stevens makes any new attempts to talk down the currency. The Bank of Japan is also expected to keep policy steady and to maintain its view of the economy. The recent slowdown in Japan’s inflation could eventually trigger more action by the BoJ, and the statement from the policy meeting should give us more insights into their next action. On Wednesday, the key event will the release of the minutes from the FOMC’s Sept. 16-17 meeting. At that meeting, the FOMC kept its “considerable period” statement, but the key point was the rise in the Fed funds forecasts. On Thursday, the spotlight will be on the Bank of England policy meeting. The Bank is unlikely to change policy and therefore the impact on the market as usual should be minimal. The minutes of the meeting though should make interesting reading when they are released on 22nd of October, especially after the continued deterioration of the UK’s economy.
Other indicators: On Tuesday, we get industrial production for August from Germany and the UK. Wednesday, from Japan we get the current account balance for August and from China the HSBC service-sector PMI is due out. Thursday, in Japan, machinery orders for August are expected to decelerate and from Australia, we get the unemployment rate for September. During the European day, in Germany, trade surplus is projected to decline a bit. Finally on Friday, Bank of Japan releases the minutes of its Sept. 3-4 policy meeting and from Canada, we get the unemployment rate for September.
The Market
EUR/USD touches 1.2500
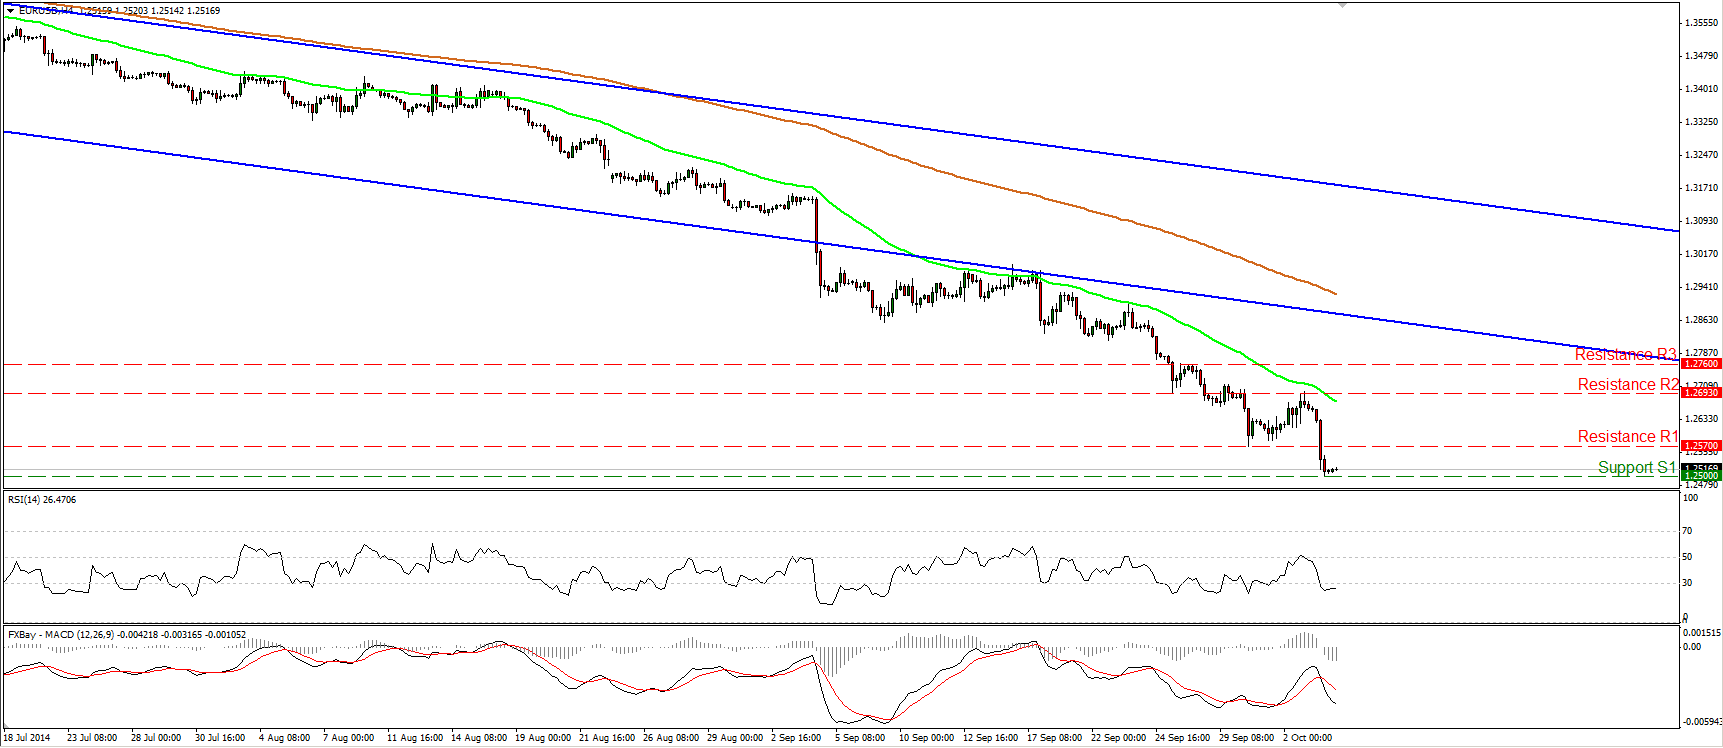
EUR/USD plunged on Friday on the strong US nonfarm payrolls data. The data caused the rate to dip below the support-turned-into-resistance line of 1.2570, defined by the low of the 30th of September, and to touch the psychological barrier of 1.2500 (S1). On the daily chart, as long as the price structure remains lower peaks and lower troughs below both the 50- and the 200-day moving averages I will maintain the view that the overall path remains to the downside. I see the next support at 1.2465 (S2), the low of the 28th of August 2012. In my view, a clear move below that hurdle could see scope for extensions towards the resistance-turned-into-support bar of 1.2385 (S3), the high of the 17th of August 2012. Looking at our daily momentum studies, the RSI remains within its oversold territory, while the MACD lies below both its zero and signal lines. This designates accelerating downside momentum and increases the possibilities for further bearish waves.
• Support: 1.2500 (S1), 1.2465 (S2), 1.2385 (S3)
• Resistance: 1.2570 (R1), 1.2693 (R2), 1.2760 (R3)
GBP/USD below 1.6000 for the first time since November
GBP/USD accelerated its declines after the strong NFP print to trade below the psychological zone of 1.6000 for the first time since November 2013. The 1.6000 line also coincides with the 50% retracement level of the prior longer-term uptrend, from the 9th of July 2013 until the 15th of July 2014. I believe that this makes Friday’s dip even more significant and keeps the bias to the downside. I would now expect the rate to challenge our support obstacle of 1.5860 (S1) in the near future, marked by the low f the 12th of November 2013. Nevertheless, bearing in mind that on the 4-hour chart the RSI shows signs of bottoming within its oversold field, I would be mindful of a near-term bounce before the next leg down. Zooming out on the daily chart, I will stick to the view that as long as Cable remains below the 80-day exponential moving average, the overall trend is to the downside.
• Support: 1.5860 (S1), 1.5720 (S2), 1.5565 (S3)
• Resistance: 1.6000 (R1), 1.6060 (R2), 1.6160 (R3)
USD/JPY rebounds from 108.00
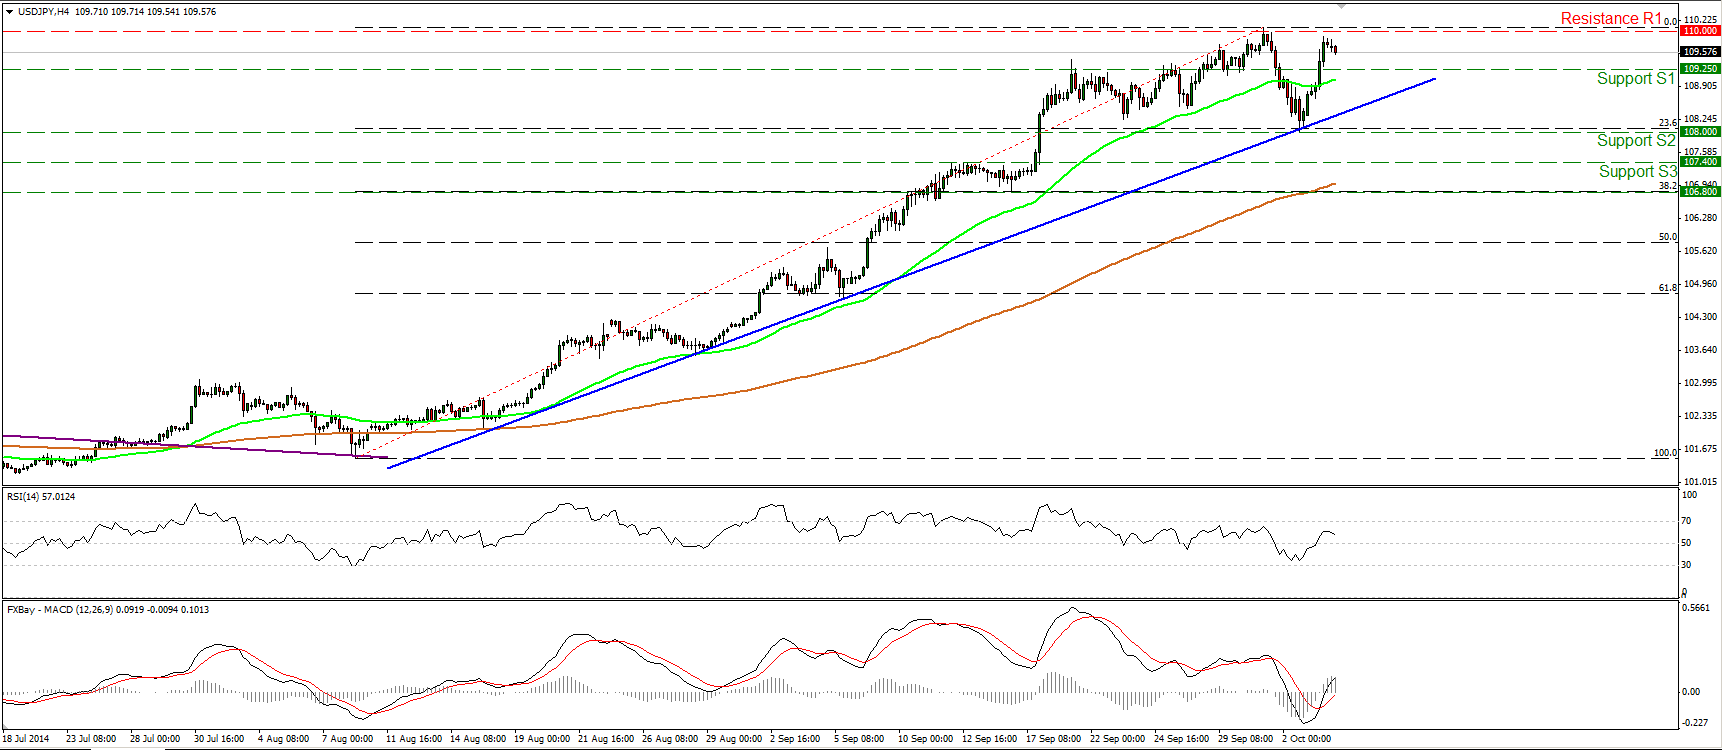
USD/JPY surged after finding support at the point of intersection between the blue uptrend line and the key line of 108.00 (S1), which happens to lie fractionally below the 23.6% retracement level of the 8th of August – 1st of October up move. During the early European morning Monday, the pair is trading slightly below the psychological line of 110.00 (R1). A decisive break could pull the trigger for our next resistance at 110.70 (R2), the highs of August 2008. On the daily chart, after the exit of a triangle formation, the price structure keeps suggesting an uptrend. Nevertheless, I would prefer to wait for the move above key obstacle of 110.00 (R1) before getting more confident on the upside. Such a move would confirm a forthcoming higher high and signal the continuation of the trend.
• Support: 109.00 (S1), 108.00 (S2), 107.40 (S3)
• Resistance: 110.00 (R1), 110.70 (R2), 111.00 (R3)
Gold dips below 1200 and touches 1183
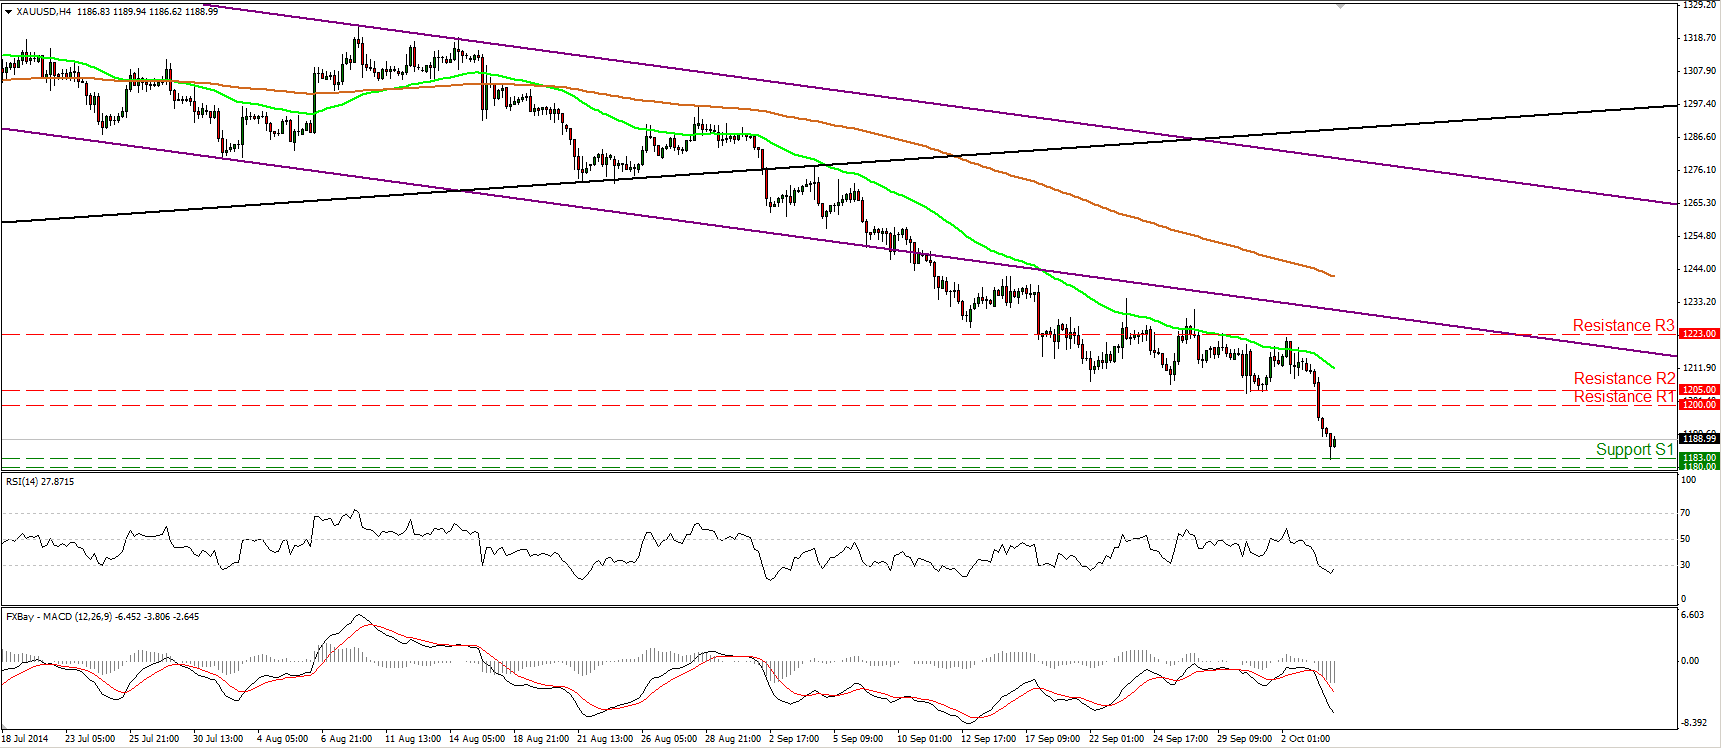
Gold also suffered after the strong US employment data and fell below the critical barrier of 1200. The dip below that psychological line caused larger bearish extensions and during the Asian morning Monday, the metal found support at 1183 (S1), a support level determined by the low of the 31st of December 2013. Although on the daily chart the price structure still suggests a downtrend, given our proximity to the aforementioned barrier and the line of 1180 (S2), the low of the 28th of June 2013, I would prefer to adopt a “wait and see” stance. The last time we saw the metal trading below these levels was back in August 2010, while in June and December 2013, when the bears reached these lines, the metal rebounded strongly reversing its course. In the case of a move below 1180 (S2), I would expect extensions towards 1156 (S3), the low of the 27th of July 2010.
• Support: 1183 (S1), 1180 (S2), 1156 (S3)
• Resistance: 1200 (R1), 1205 (R2), 1223 (R3)
WTI finds support at 92.00
WTI found resistance at 91.80 (R2) forming a lower high, and fell again back below 90.00. If the bears are willing to maintain the rate below 90.00 (R1), I would expect them to challenge again Thursday’s low of 88.15 (S1). However, only a dip below that line would confirm a forthcoming lower low on the daily chart and signal the continuation of the longer-term downtrend. Such a move could see scope for further declines, perhaps towards our next support at 86.00 (S2). Taking a look at our daily momentum studies we see that both of them confirm the recent bearish momentum. The RSI lies below 50, while the MACD, already negative, moved below its signal line.
• Support: 88.15 (S1), 86.00 (S2), 84.15 (S3)
• Resistance: 90.00 (R1), 91.80 (R2), 93.00 (R3)

