The U.S. Dollar Index is finishing May in a strong position. The renewed sovereign-debt crisis in Europe helped give the greenback a boost as traders fled higher-risk assets for the safety of the lower-yielding dollar. This week the focus turned to Japan as the yen fell against the U.S. dollar after Fitch Ratings cut Japan’s sovereign-debt rating to A+ from AA.
These fundamental events helped the USD retrace better than 50% of its break from June 2010 to May 2011 while putting it in a position to challenge the key 61.8% retracement level. Besides these percentage retracement levels, the Index is also in a position to take out the high for the year at 81.78. Finally, continued strength has also put the Index in a position to cross over to the bullish side of a long-standing Gann angle.

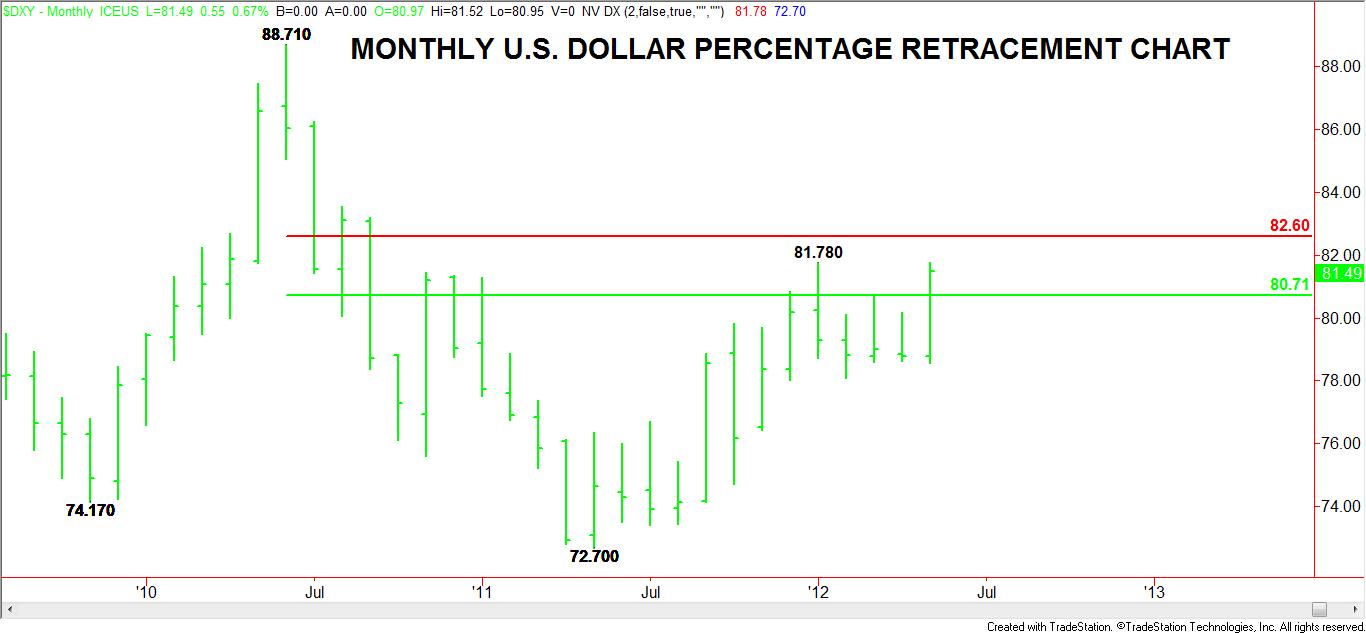
The first area of interest to look at is the simplest. This is the monthly U.S. dollar percentage retracement zone (Figure 1). Based on the main range created by the June 2010 top at 88.71 and the May 2011 bottom at 72.70, a 50 to 61.8 retracement zone has been created at 80.71 to 82.59.
As you can see, starting in November 2011, the 50% price level has been tested several times. In December 2011 it was actually penetrated with the move stopping at 81.78. Currently, the Index is trading on the bullish side of the 50% price level. What is most important, however, is that unless the dollar weakens significantly over the next seven trading sessions, it is going to close over the 50% level. This will put the Index in a position to trade higher in June.
While crossing to the bullish side of the 50% price is a sign of strength, establishing support at this price level is even more important. If traders can support the Index at 80.71, then this may propel the market into the Fibonacci level at 82.59. This may prove to be resistance on the first test of this key level, but a breakout over it is likely to lead to an acceleration to the upside.
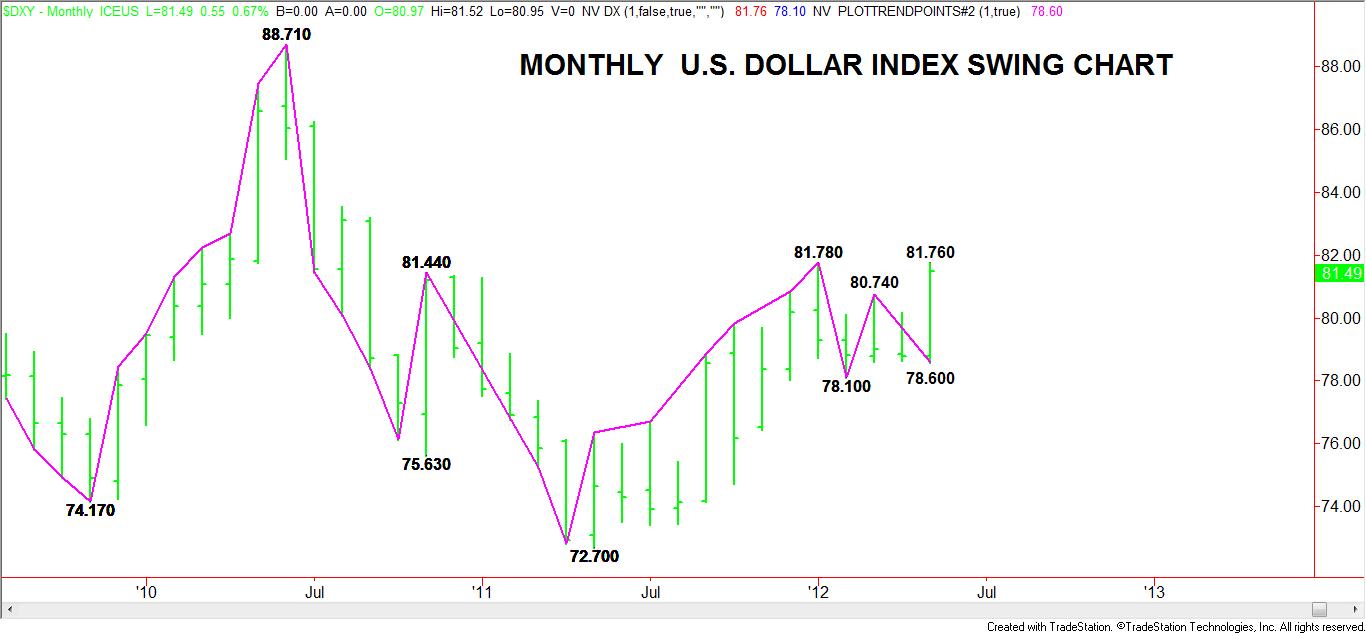
 The next important chart to watch is the monthly U.S. Dollar Index Swing Chart (Figure 2). The simple definition of an uptrend is higher-tops and higher-bottoms. This chart clearly shows the formation of higher bottoms at 78.10 and 78.60.
This month’s strong rally put the market in a position to breakout above the key swing top at 81.78. A move through this level could launch a strong swing to the upside. Once the trend turns up, traders will have to defend the swing bottoms or things will turn back down.

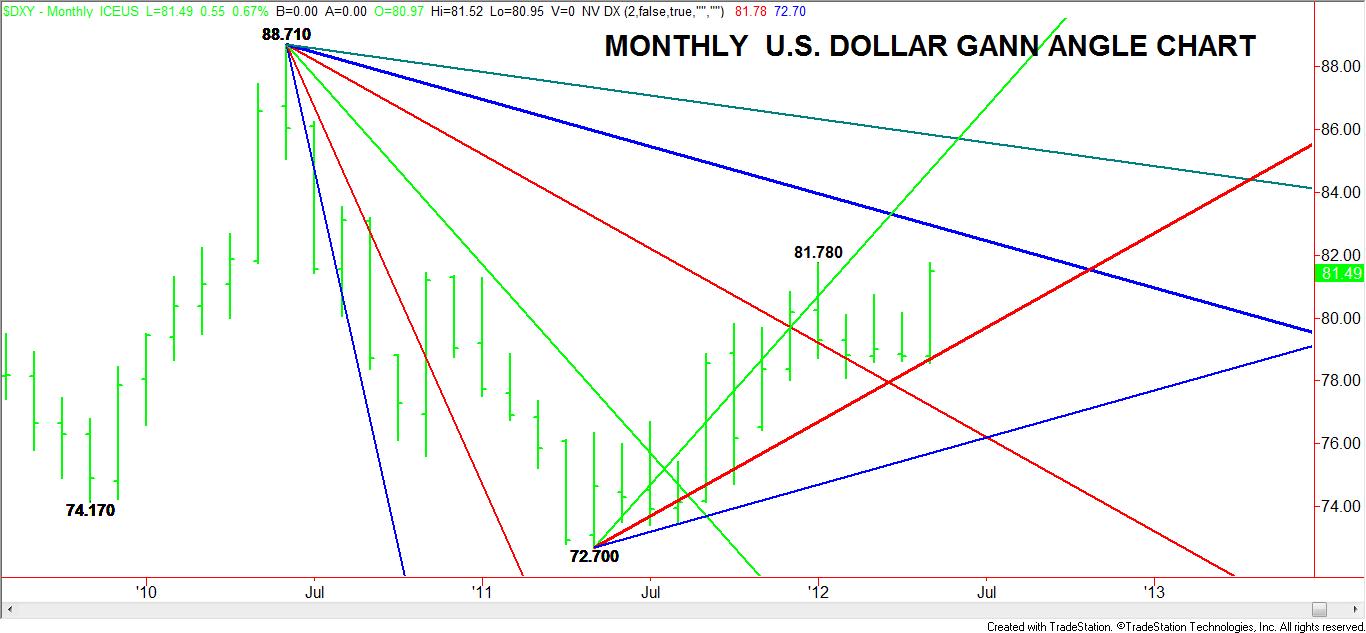
The last chart to watch is the monthly U.S. Dollar Gann Angle Chart (Figure 3). This chart follows the market's price and time movement. Since bottoming in May 2011 at 72.70, the Index has followed a pair of uptrending Gann angles. During May, one of these angles provided support at 78.70. The other has moved up to 84.70.
Besides uptrending Gann angles, the downtrending Gann angle from the 88.71 top could become significant during the last week of the month. This angle drops in at 82.96 in May. Like the horizontal percentage retracement levels, this angle may act as resistance point on the initial test, but as a pivot if it is violated. A breakout through this angle -- coupled with momentum -- could drive the Index to the next downtrending Gann Angle at 85.84, but this is more likely in the months to follow if the trend remains up.
As we come to the end of May, all signs point toward a strong start for the U.S. dollar in June. There may be a few speed bumps encountered along the way, but as long as the Index continues to post higher-tops and higher-bottoms, the bias will be to the upside.
These fundamental events helped the USD retrace better than 50% of its break from June 2010 to May 2011 while putting it in a position to challenge the key 61.8% retracement level. Besides these percentage retracement levels, the Index is also in a position to take out the high for the year at 81.78. Finally, continued strength has also put the Index in a position to cross over to the bullish side of a long-standing Gann angle.

The first area of interest to look at is the simplest. This is the monthly U.S. dollar percentage retracement zone (Figure 1). Based on the main range created by the June 2010 top at 88.71 and the May 2011 bottom at 72.70, a 50 to 61.8 retracement zone has been created at 80.71 to 82.59.
As you can see, starting in November 2011, the 50% price level has been tested several times. In December 2011 it was actually penetrated with the move stopping at 81.78. Currently, the Index is trading on the bullish side of the 50% price level. What is most important, however, is that unless the dollar weakens significantly over the next seven trading sessions, it is going to close over the 50% level. This will put the Index in a position to trade higher in June.
While crossing to the bullish side of the 50% price is a sign of strength, establishing support at this price level is even more important. If traders can support the Index at 80.71, then this may propel the market into the Fibonacci level at 82.59. This may prove to be resistance on the first test of this key level, but a breakout over it is likely to lead to an acceleration to the upside.
 The next important chart to watch is the monthly U.S. Dollar Index Swing Chart (Figure 2). The simple definition of an uptrend is higher-tops and higher-bottoms. This chart clearly shows the formation of higher bottoms at 78.10 and 78.60.
 This month’s strong rally put the market in a position to breakout above the key swing top at 81.78. A move through this level could launch a strong swing to the upside. Once the trend turns up, traders will have to defend the swing bottoms or things will turn back down.

The last chart to watch is the monthly U.S. Dollar Gann Angle Chart (Figure 3). This chart follows the market's price and time movement. Since bottoming in May 2011 at 72.70, the Index has followed a pair of uptrending Gann angles. During May, one of these angles provided support at 78.70. The other has moved up to 84.70.
Besides uptrending Gann angles, the downtrending Gann angle from the 88.71 top could become significant during the last week of the month. This angle drops in at 82.96 in May. Like the horizontal percentage retracement levels, this angle may act as resistance point on the initial test, but as a pivot if it is violated. A breakout through this angle -- coupled with momentum -- could drive the Index to the next downtrending Gann Angle at 85.84, but this is more likely in the months to follow if the trend remains up.
As we come to the end of May, all signs point toward a strong start for the U.S. dollar in June. There may be a few speed bumps encountered along the way, but as long as the Index continues to post higher-tops and higher-bottoms, the bias will be to the upside.
