
USD rallied during the European day yesterday as the GDP figures confirmed that the Eurozone is well and truly in recession, plus French prices showed disinflation. However enthusiasm for the US currency started to cool once the US data started arriving. The Empire State manufacturing survey and industrial production were both below estimates. The last indicator of the day, the National Association of Homebuilders housing market index, was better than expected and USD recovered somewhat.
I had been expecting inflows into the US stock market to power the USD higher, but on the contrary, yesterday’s TIC data showed that US investors purchased record amounts of foreign equities in March, while foreign purchases of US assets are tailing off. Nonetheless DXY was up about 4% during the first three months of the year. Now that risk on = buy USD, I would expect inflows to turn around and USD to move even higher. The one exception is US flows to Japan. The Japanese data out yesterday showed large foreign purchases of Japanese stocks, which seem likely to continue with the Japanese market still at only half its record level (set back on 29 Dec 1989! Just remember that when next someone tells you “stocks always go up in the long term.”) Foreign purchases of Japanese stocks could continue and be a moderating influence for USD/JPY, although I would expect these inflows to be overwhelmed over time by Japanese purchases of foreign assets.
Not much in the way of indicators out of Europe today, except for final Eurozone CPI, which is not likely to deviate much from the preliminary 1.2%. The US has a fairly busy day, though. CPI for April is expected to be down 0.3% mom, an acceleration from March’s 0.2% mom decline. There don’t seem to be a large number of people on the FOMC who are worried about inflation being too low any more however as inflation is still within the Fed’s comfort zone and the focus is on whether employment is getting back to normal. For initial jobless claims, the market is looking for a small rise to 330k from 323k. That would still bring the four-week moving average down to 331 from 337, so it’s an improvement and should be USD-positive. Housing starts are forecast to be down to 970k from 1,036k, which could counter some of the optimism caused by yesterday’s NAHB survey. But on the other hand, the Philadelphia Fed survey is expected to rise slightly to 2.0 from 1.3, which could counter some of the pessimism caused by yesterday’s Empire State survey. The two surveys only move in the same direction about half the time, and over the last year have had a negative correlation (-26%).
The Market
EUR/USD
 EUR/USD" title="EUR/USD" width="1734" height="805">
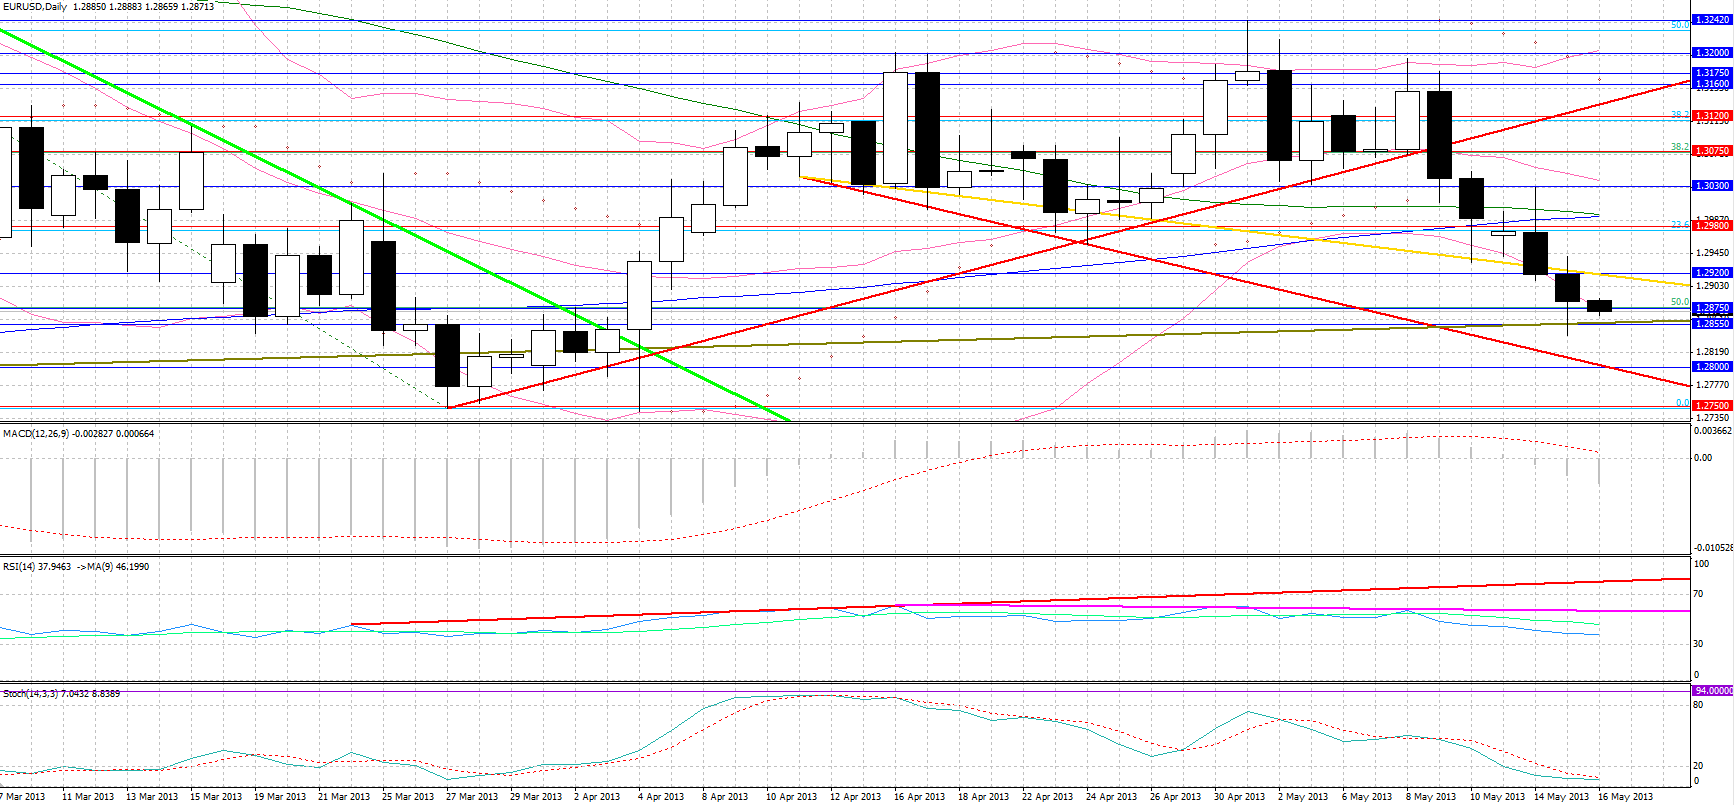
• EUR/USD was driven to head-and-shoulders neckline support at 1.28550 following the release of weaker than expected core Eurozone GDP figures, with France officially in a recession again and Germany narrowly avoiding a recession with a 0.1% expansion. The weighting attributed to these countries consequently led the Eurozone GDP figures to miss expectations for a second consecutive quarter. Resistance following the worse-than-anticipated mom PPI and the first negative NY Empire State Manufacturing Index reading since January came around 1.2880, with the better than forecasted NAHB Housing Market Index reversing the rebound. 1.2875, the 50% retracement level of the July 2012 – February 2013 up move looks to be interchanging as a support and resistance, with further resistance at 1.2920 and 1.2980.
Today we may see the completion of the 50-day/200-day MA “death cross”, with the 50-day MA moving under the 200-day MA. A 20-year backtest reveals that 57% of “death crosses” (8 out of 14) result in successful down moves with less than a 0.5% drawdown, generating a mean return of 3.3% within an average of 18 days, or a median return of 0.85% over six days. Should we have a breakdown from the support neckline, an initial support level comes at 1.2800, with a strong support at 1.2680, the 61.8% retracement level of the aforementioned bull market. The target set by the head-and-shoulders formation is around 950 pips, though it is important to note that only around 50% of these formations fulfill their target. A more conservative measure places a target of 1.2500, which coincides with the upward-sloping support trendline that holds since the start of the euro. The average of the two targets comes at around 1.2100, which sees the support trendline that holds since the end of 2005 and which coincides with the historic daily average for the pair.
USD/JPY 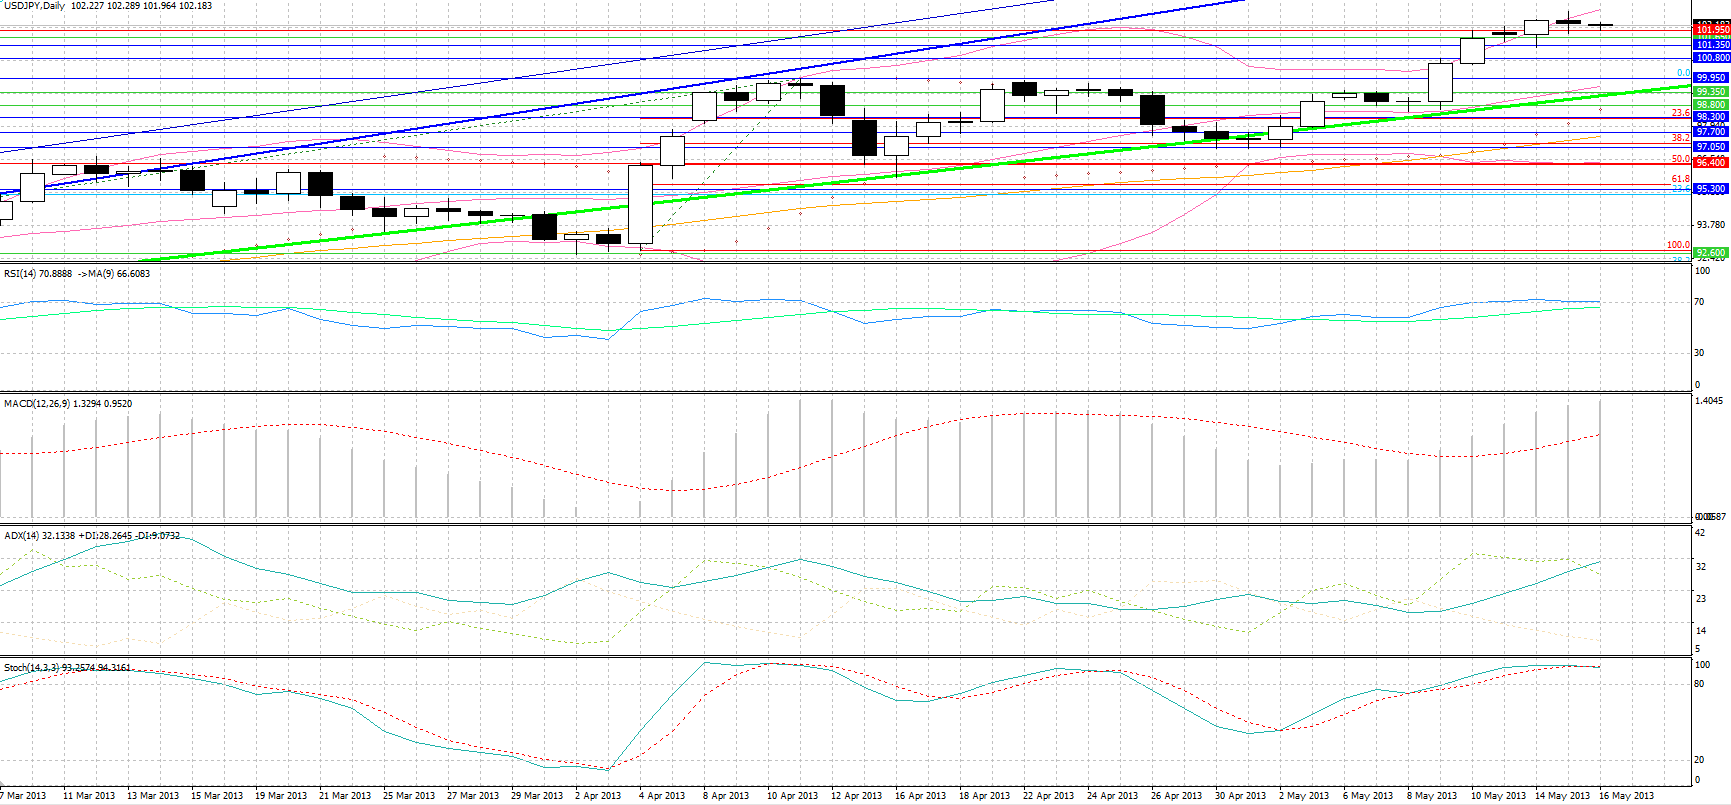 USD/JPY " title="USD/JPY " width="1731" height="805">
• USD/JPY formed a spinning top candlestick yesterday signaling uncertainty with regards to direction. The pair retraced from the 102.70 highs following the release of weak U.S. data, particularly the PPI, with support coming at 101.95. The rebound following the strong NAHB Housing Market Index was short-lived as there was some profit taking, with the worse-than-forecasted GDP deflator figure and the strong GDP growth figure retesting support. With the momentum on the pair apparently turning bearish, it seems that upside potential is limited, unless we see strong U.S. data today. That could move the pair towards 103.90 resistance, with the next support levels coming at 101.65 and 101.35.
GBP/USD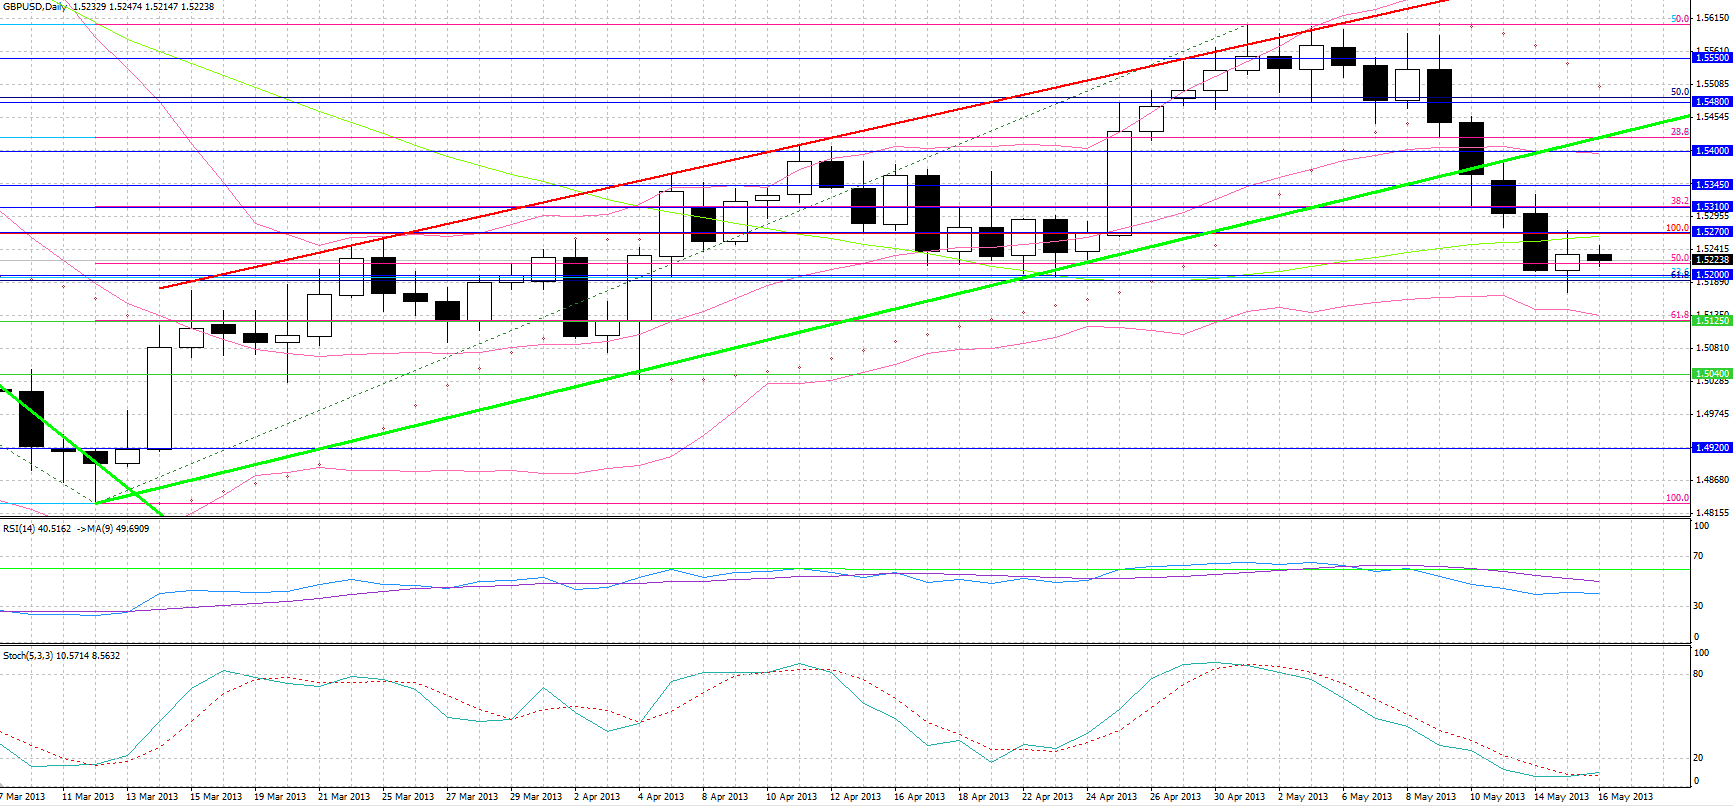 GBP/USD" title="GBP/USD" width="1733" height="806">
• Cable spent the day between 1.5200 strong support, which sees three notable Fibonacci levels, and 1.5270 resistance, the reversal of the June 2012 – January 2013 rally. Rebound from support followed the better than estimated U.K. employment data, with the ILO unemployment rate coming in at 7.8%, an improvement of the forecasted stable rate of 7.9%. Claims also decreased by more than forecasted adding to the rebound, with BoE Governor King’s speech with regard to 0.5% next quarter growth not impacting the pair in any substantial way. A breakdown from 1.5200 may see support at 1.5125, the 61.8% retracement level of the March – May rebound, with further support at 1.5040. Resistance above 1.5270 may come at 1.5310.
Gold
• Gold was a major loser yesterday, plunging as the U.S. PPI data reinforced the view that inflation is the least of concerns for the U.S., with the Eurozone CPI today due to go into deflationary territory again. The breakdown from $1423 support drove the pair to $1390 support, with resistance coming at $1400. A breakdown from the $1385 - $1390 area may move price towards $1370, with $1350 being another weak support.
WTI
• WTI had a volatile day, hitting $92.35, the 200-day MA support, following the weak Eurozone GDP figures and the generally weak U.S. data. A rebound however to $94.50 Fibonacci resistance was triggered as crude stockpiles saw an unexpected decrease, leading to a hammer candlestick, which may hint an end of the downtrend. Nonetheless, the RSI and the Stochastics are still downward sloping , and we would need some confirmation before going long. $93.40 and $92.35 are yet again support levels with trendline and Fibonacci resistance coming at $95.50, and further resistance at $96.60.
BENCHMARK CURRENCY RATES - DAILY GAINERS AND LOSERS
MARKETS SUMMARY
- English (UK)
- English (India)
- English (Canada)
- English (Australia)
- English (South Africa)
- English (Philippines)
- English (Nigeria)
- Deutsch
- Español (España)
- Español (México)
- Français
- Italiano
- Nederlands
- Polski
- Português (Portugal)
- Português (Brasil)
- Русский
- Türkçe
- العربية
- Ελληνικά
- Svenska
- Suomi
- עברית
- 日本語
- 한국어
- 简体中文
- 繁體中文
- Bahasa Indonesia
- Bahasa Melayu
- ไทย
- Tiếng Việt
- हिंदी
Dollar Gains On Eurozone Remains
Published 05/16/2013, 07:19 AM
Updated 07/09/2023, 06:31 AM
Dollar Gains On Eurozone Remains
Latest comments
Loading next article…
Install Our App
Risk Disclosure: Trading in financial instruments and/or cryptocurrencies involves high risks including the risk of losing some, or all, of your investment amount, and may not be suitable for all investors. Prices of cryptocurrencies are extremely volatile and may be affected by external factors such as financial, regulatory or political events. Trading on margin increases the financial risks.
Before deciding to trade in financial instrument or cryptocurrencies you should be fully informed of the risks and costs associated with trading the financial markets, carefully consider your investment objectives, level of experience, and risk appetite, and seek professional advice where needed.
Fusion Media would like to remind you that the data contained in this website is not necessarily real-time nor accurate. The data and prices on the website are not necessarily provided by any market or exchange, but may be provided by market makers, and so prices may not be accurate and may differ from the actual price at any given market, meaning prices are indicative and not appropriate for trading purposes. Fusion Media and any provider of the data contained in this website will not accept liability for any loss or damage as a result of your trading, or your reliance on the information contained within this website.
It is prohibited to use, store, reproduce, display, modify, transmit or distribute the data contained in this website without the explicit prior written permission of Fusion Media and/or the data provider. All intellectual property rights are reserved by the providers and/or the exchange providing the data contained in this website.
Fusion Media may be compensated by the advertisers that appear on the website, based on your interaction with the advertisements or advertisers.
© 2007-2024 - Fusion Media Limited. All Rights Reserved.