The U.S. dollar has been holding strong in a broad range for nearly 9 months. Measured via the U.S. Dollar Index it has held between 93 and 98 since May 2018. It has been rock solid. And even though it is now pulling back from the top of the range, it has still maintained its strength. But is that about to change?
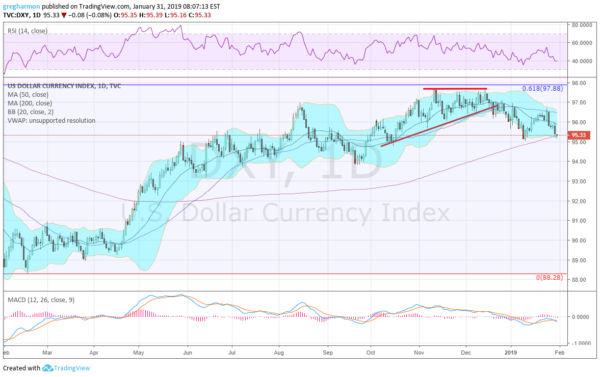
The chart below shows the U.S. Dollar Index over the past 12 months. After rising out of consolidation in April last year it pushed over its 200 day SMA at the start of May and kept going. Since late May the Index has remained over 93 and for the first 6 months drifted higher. Since the middle of December though it has been drifting lower.

With the strong move lower following the January FOMC statement, where they said they would be more patent with both the balance sheet runoff and rate hikes, the Dollar Index finds itself back at its 200 day SMA. Will it fall below and end the strong dollar run? The evidence is mounting that supports a deeper drop.
Momentum is dropping. The RSI is back at the lower edge of the bullish zone with the MACD crossed down and negative. The Bollinger Bands® are opening to the downside to allow a move lower as well. A move under 95 would trigger sellers, but there is still significant history below that until it moves below 94. That is when “the top” may be in.
The information in this blog post represents my own opinions and does not contain a recommendation for any particular security or investment. I or my affiliates may hold positions or other interests in securities mentioned in the Blog, please see my Disclaimer page for my full disclaimer.
