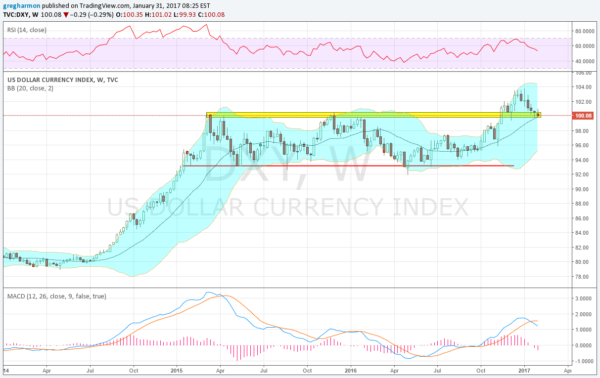
The U.S. dollar moved into a channel between 93.50 and about 100 at the start of 2015. It had several touches at both the bottom and the top of the channel over the next 22 months before breaking the channel to the upside in November. This looked like a real show of dollar strength at the time. But it only made it to 102, less than 2 points out of the channel, before falling back. It held the breakout level and bounced, this time getting all the way to 103. But failure struck there as well with another pullback to the breakout level.
And that's where USD sits now, thinking about its next move for the past two weeks. Crawling sideways along the support at the big round 100 number. The second pullback certainly gives pause for any thoughts of a dollar rally to new highs. And the technicals do not look good on a short-term basis. Momentum remains weak. The RSI is still in the bullish zone while crawling along the bottom of the range. The MACD has started to level and is at a point where it has turned back higher in the past, but no turn yet.
It is the longer-term weekly chart that may hold the key to the dollar’s next move. This view is much more bullish than the daily chart. Momentum indicators are higher in bullish ranges, but there's still downward pressure. The RSI on this timeframe is falling toward the mid line, while the MACD has crossed down, but remains positive. Not yet a reason to buy but holding stronger than the short-term view.
The key might be the reaction to its 20-week (100-day) SMA, which has risen to meet the Dollar Index as it sits in the prior breakout zone. Generally it has been bullish for the dollar to remain above this moving average and bearish below it for at least the last 3 years. A weekly close below it, currently at 99.80, could mean the bullish run since July is over. That would suggest a move to 95 or even the bottom of the channel at 93.50. Plenty of catalyst this week with the FOMC decision Wednesday and the nonfarm payrolls on Friday. Keep an eye here.

