We have always admired and respected any trader, analyst, cowboy or factor who is clear on his market call. Dozens of newsletters, press stories, speeches and whatever are more often larded up with two-sided predictions and on the other hand type analysis to leave the trading public more in confusion. Not so for Dr. OA Cleveland, cotton sage of Mississippi State. In a story released on Robert E Lees birthday, Cleveland throws out the possibility of $1 cotton, due to on-call sales, and says there is hardly any reason to be bearish. He sees Mar quickly rising above 85c, and will not stop there. Cleveland accepts the Indian missing stocks theory as bona fide. We recommend reading his column, go to Cotton Grower mag and find it. One more thing, his acreage estimate for new crop is 13.35 M, same as ours. Smart man.
Varner View
For now the market has rejected the notion that 85c would soon give way, and has entered either a consolidation or correction. Open interest and spec position argue for something larger than that, but on-call purchases argue for large price-fixing on any and all dips. Our guess is that cotton is entering a choppy phase, one that can be traded on both sides. We are not sure how deep a correction can reach, but for now it is clear that 8500 is a tick too high.
Technicals
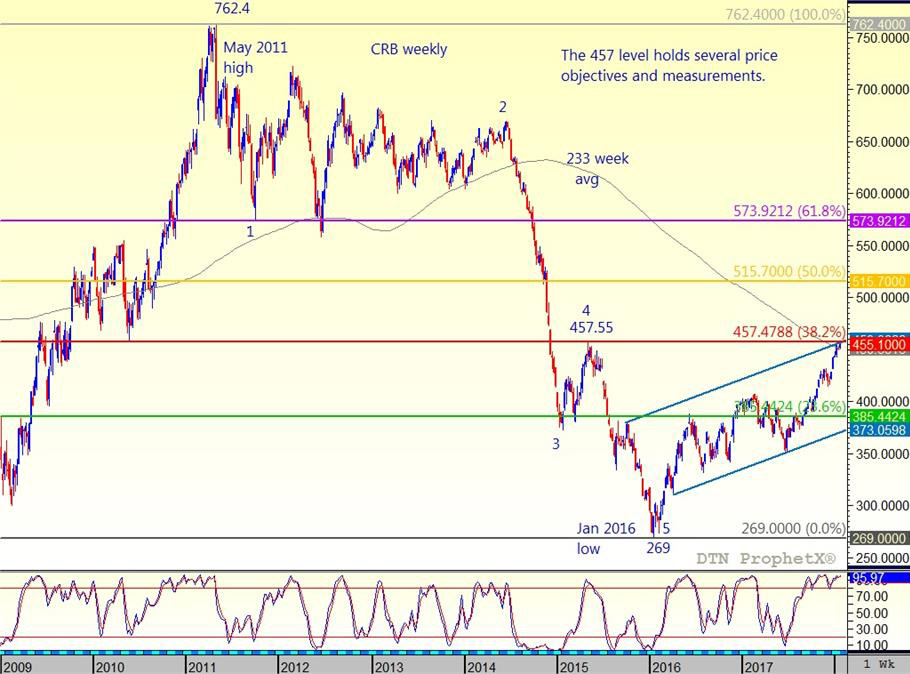
Repeating a bit, we found 4 ways to measure or calculate the CRB retrace at 457. First is the common Fib 38.2% retrace from May 2011 high to Jan 2016 low. Second is the major 4 wave high at 457. Third is a price channel with support line off lows of Apr 2016 and June 17, and resistance line parallel with support, anchored at high of Oct 2015. Fourth is the 233 week average, crossing this week at 455. The CRB is nearly 40% energy, so these two charts look nearly identical. The other aspect of both the CRB and crude is the cyclic occurrence of price reversals on 52 week intervals. January highs and lows are very common. Major or multi-year lows were made in Jan in 99, 02, 07, 09, 15, and 16. Intermediate highs were made in 08, 10, 13 and 17. An intermediate low was made in 05 and 14.

Disclaimer: Trading Futures, Options on Futures, and retail off-exchange foreign currency transactions involves substantial risk of loss and is not suitable for all investors. You should carefully consider whether trading is suitable for you in light of your circumstances, knowledge, and financial resources. Any decision to purchase or sell as a result of the opinions expressed in the forum will be the full responsibility of the person(s) authorizing such transaction(s). BE ADVISED TO ALWAYS USE PROTECTIVE STOP LOSSES AND ALLOW FOR SLIPPAGE TO MANAGE YOUR TRADE(S) AS AN INVESTOR COULD LOSE ALL OR MORE THAN THEIR INITIAL INVESTMENT. PAST PERFORMANCE IS NOT INDICATIVE OF FUTURE RESULTS.
