The US Dollar started moving higher at the end of September, the same time the stock market peaked. As it moved into October it was approaching the August highs. It reached and took out that high in November but then stalled. It looked like a broad consolidation was under way.
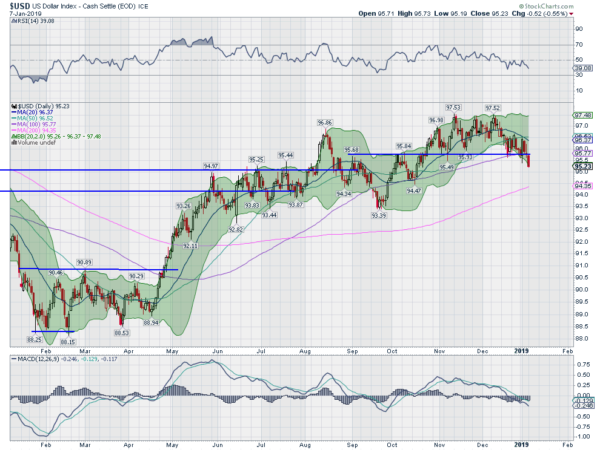
The sideways motion held the Dollar Index (below) in a tight range between 96.50 and 97.50 for a month. In the middle of December that range shifted lower, but remained tight, between 95.75 and 96.50. It continued to bounce along, holding over its 100 day SMA until Monday.

The Dollar Index broke down Monday. It was not a massive move, a half of a point, but it was significant. It fell below that 100 day SMA. It broke prior support levels. And it did it with a drive lower ending at the low of the day. Momentum sets up for it to continue lower. The RSI is falling and on the cusp of the bearish zone. The MACD is also negative and moving lower.
The next significant level to watch for is the 200 day SMA, currently at 94.35. It has been above the 200 day SMA since April. A breach of the 200 day SMA then brings focus to 93.50. This level has held it since May. Below that would have longer term bearish implications.
The information in this blog post represents my own opinions and does not contain a recommendation for any particular security or investment. I or my affiliates may hold positions or other interests in securities mentioned in the Blog, please see my Disclaimer page for my full disclaimer.
