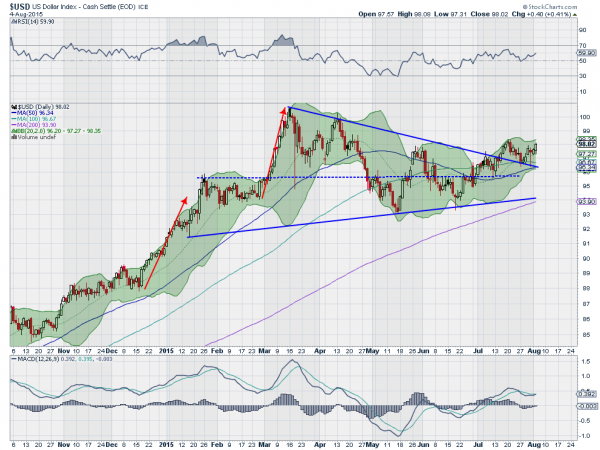
One month ago I wrote here about Preparing For A Dollar Break Out. The US Dollar Index had been moving in a symmetrical triangle pattern and had just made its 5th touch of the triangle side. It seemed ready for the next move to the upside.
This was important because the US dollar has shown that it likes to trend in cycles close to 7 years long. If it was done after just one year this time it would be very unique. Fast forward to now and the break of the triangle did happen. So what is in store with an extra month of data?

The chart above updates the price action and shows an almost perfect pattern. The index broke above the triangle and ran to a new higher high. From there it pulled back and retested the break out level. Finally a reversal back higher is a textbook move. Traders love when this happens, breakout, retest and go.
The momentum indicators remain bullish, with the RSI bouncing off of the mid line during the retest. The MACD had a shallow pullback but is already crossing to the upside. And notice the angle of the Bollinger Bands® has turned to the upside. This is a perfect time to get into the Dollar Index against a stop at 96.50. Using the ETF UUP, 25.20 is a good stop.
The targets of 106 and 115 from the prior post remain as your objective but a new interim level of 100.50 comes out of this retrace and move higher. That should not be a surprise as it is right at the prior high level from March.
Disclaimer: The information in this blog post represents my own opinions and does not contain a recommendation for any particular security or investment. I or my affiliates may hold positions or other interests in securities mentioned in the Blog, please see my Disclaimer page for my full disclaimer.
