The US dollar had a tough week. It fell against all the majors but the Swiss franc and Japanese yen. Like the dollar, they are often used to fund the purchases of higher-yielding or more volatile assets, giving a greater appearance of safe-haven when those other assets go south, which invariably they do. Sterling and the Australian dollar recorded new nearly three-year highs.
The greenback appeared to reverse higher on February 16. There was follow-through the next day, but it proved for naught, and the dollar finished the week near its lows. Higher US yields failed to offer lasting support. The dollar fell when stocks rose and later when stocks fell. Intermarket correlations are far from stable, especially in the short-run, even in the best of times. They seem particularly volatile now.

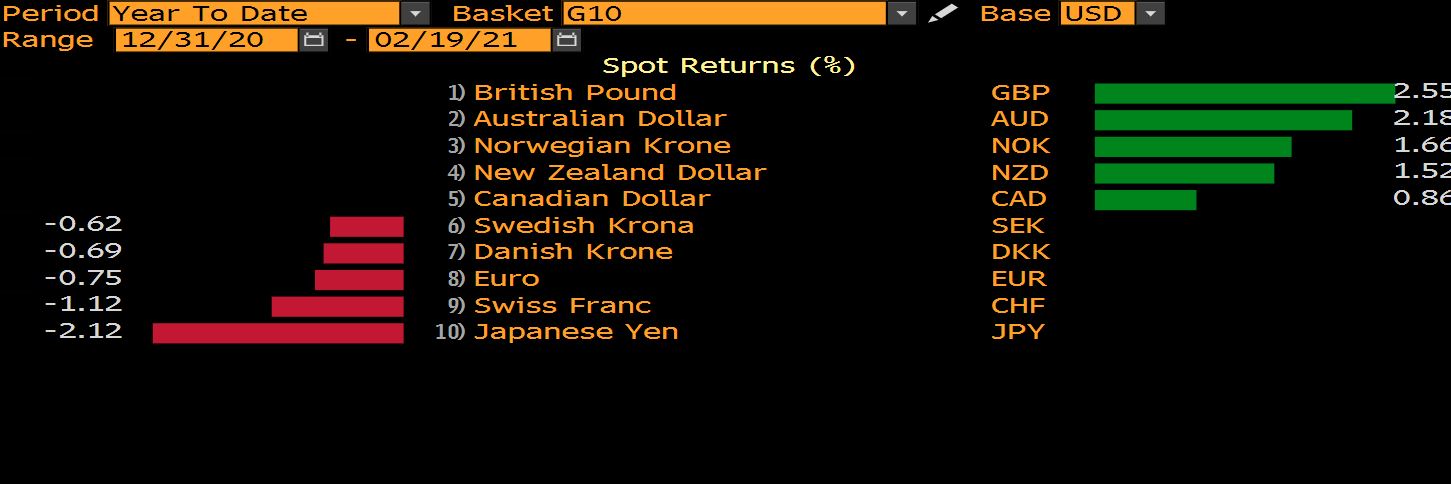
Sometimes the dollar is the key mover; other times it sort of serves as a fulcrum among the major currencies. This is one takeaway from the year-to-date performance of the major currencies shown in the Bloomberg table above. This is not just an echo from January. The top five currencies are also the best performers here in February. The powerful reflation theme spurred by optimism over the vaccine, significant US fiscal stimulus, and the broadening of the Asia Pacific region's recovery is being expressed in the foreign exchange market. The dollar-bloc currencies and Scandis often are seen levered for growth. By shifting the funding of its reserves to domestic sources, Sweden's Riksbank has countered inflows.
Sterling's uptrend has been nothing short of astonishing. In the past 16 weeks, stretching back to the end of last October, sterling has fallen in only two weeks. In that span, it has risen around 11 cents (~8.4%) to nearly $1.4050. Some argue that with the UK leaving the EU, sterling's quantitative characteristics may change, but it seems too early to suggest a paradigm shift. Its performance may have more to do with the stimulus and the relatively successful distribution of the vaccine. Also, there was a shift in expectations as the market gave up ideas that the BOE would bring the base rate below zero. Speculators in the futures market have amassed the largest gross and net long sterling exposure since last March. The next important chart area is not until the double top from 2018 (~$1.4345-$1.4375).
Dollar Index: A key reversal day was recorded on February 16. After making a new low for the move near 91.00, the Dollar Index reversed higher and closed above the previous session high. Strong follow-through buying lifted it a little above 91.00 the following day. However, that marked the high, and the Dollar Index traded below 90.20 ahead of the weekend. A break of 90.00 confirms the underlying downtrend has resumed. It would signal a test on last month's low near 89.20 and beyond if the 91.00 is a topping pattern's neckline. The momentum indicators are not particularly helpful now. The MACD is softening from high levels, while the Slow Stochastic has turned up.
Euro: The euro overshot the $1.2150 on an intraday basis but reversed lower and fell to almost $1.2020. It recovered just as impulsively as it sold-off and before the weekend was knocking on the $1.2150 area again. The $1.22 area is the (61.8%) retracement objective of the decline from the January 6 high near $1.2350. As with the Dollar Index, the momentum indicators are generating contradictory signals. Net-net, the euro is practically flat so far this month, having finished January around $1.2135.
Japanese Yen: The dollar has been trending higher this year against the Japanese yen, as one might expect if traditional intermarket relationships were holding. Rising equities and rising (US yields) typically weigh on the yen. The dollar poked through JPY106.20 last week, its best level since last September, and the (50%) retracement of the decline since last June. The greenback's broader pullback saw it drop nearly a full yen, but it rebounded smartly and finished the week above a touch below the 200-day moving average (~JPY105.50). The momentum indicators are not generating a strong signal, but we like it higher. The next target area is near JPY107, which houses the (61.8%) retracement objective and the highs from last August.
British Pound: Sterling's advance continued last week. As we have seen, it is the strongest of the major currencies this year, appreciating about 2.5% against the dollar and around 1.7% against the euro. It gained almost 1.2% last week alone. The MACD continues to trend higher. The Slow Stochastic has been moving broadly sideways at elevated levels in recent days. Initial support is seen in the $1.3950 area, but it would probably take a break of $1.3780-$1.3800 to signal something important is at hand.

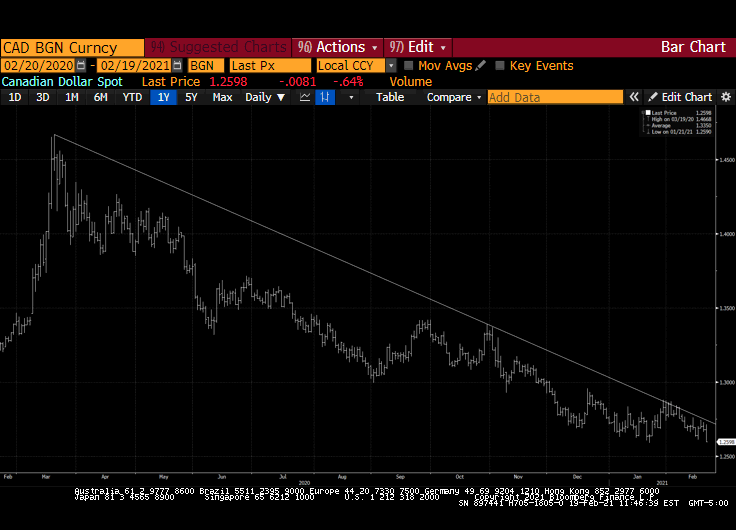
Canadian Dollar: The US dollar fell to CAD1.2600 to test its lowest level since April 2018. After a few days of decline, the recovery in stocks, firm commodity prices, even if oil was a little softer, provided a constructive backdrop for the Canadian dollar. Canada's two- and 10-year yields rose more than the US not just last week but year-to-date as well. A sustained break of CAD1.26 targets CAD1.25. The down trendline from last March's highs frayed a little at the end of January and early February, but it has largely remained intact. It begins the new week near CAD1.2735.
Australian Dollar: The Aussie rose almost 1.5% against the US dollar last week to bring its appreciation to about 12.5% since the end of last October. It was the third consecutive weekly gain, and the pre-weekend gain of 1.35% appears to be the largest in three months. The Australian dollar benefits from two reflation elements: rising commodity prices and the broadening expansion in Asia. Australia's market rates are also moving up faster than in the US. The next important target is around $0.8000 and then the double top from September 2017 and January 2018 in the $0.8125-$0.8135 area. The MACD is moving higher, but the Slow Stochastic is looks poised to cross lower. A break below the $0.7700-$0.7725 warns of a false upside break out and raises the likelihood of a test on $0.7600.

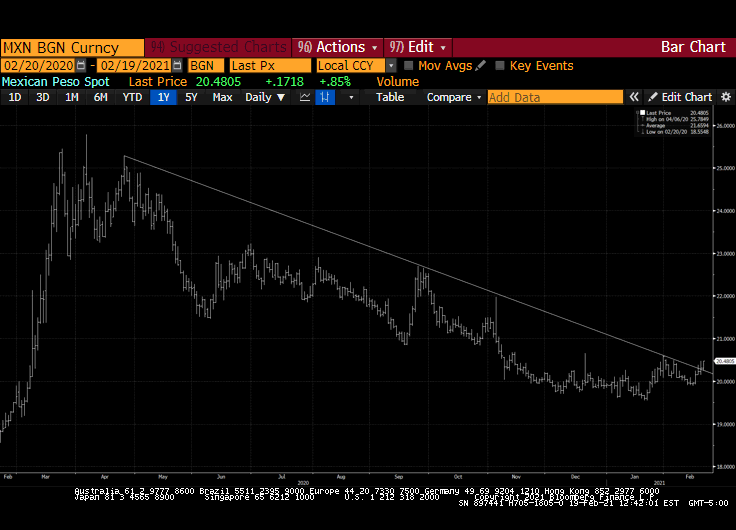
Mexican Peso: The peso fell out of favor last week, tumbling about 2.5% against the US dollar, making it the weakest currency. It fell every day last week for the first time in ten months. One of Mexico's key draws was its relatively higher interest rates, but rising global yields reduces the attractiveness. Over the past month, the US Treasury yield rose 25 bp to 1.35%, while Mexico's 10-year dollar bond yield slipped three basis points to 2.73%. The natural gas disruption emanating from Texas forced auto producers and other manufacturers in Mexico to slow. The disruption may be severe enough to spur economists to reduce Q1 GDP forecasts when many expect the economy to be contracting. For the past three months, the dollar was mostly confined to an MXN19.55-MXN20.50 trading range. Spikes had seen around MXN20.6650 (December 2020) and nearly MXN20.60 (late January). While the US dollar has held below a similar trend line against the Canadian dollar, it has broken above it against the Mexican peso. The next target is in the MXN20.65-MXN20.70 area. The MACD has turned higher from elevated levels, while the Slow Stochastic is turning higher from the lower end of the range. Initial support may be in the MXN20.20 area.
Chinese Yuan: The yuan has appreciated by almost 1.1% this year, making it the second-best emerging market currency behind the Turkish lira's roughly 6.7% gain. Those wide interest rate differentials that had added to China's attractiveness have been reduced. In mid-November, Beijing paid 250 bp more than the US to borrow for 10-years. Now the premium is near 190 bp. With a few exceptions, the dollar has been in a clearly identified range against the yuan since the start of the year: CNY6.43-CNY6.50. The dollar fell for eight months against the yuan through January. The dollar settled last month at the lower end of the range, which was the lowest since mid-2018. While continued range-trading is the most likely scenario, we suspect that if the range were to break now, it would most likely be in the direction of a stronger dollar. Although the dollar may be on the fulcrum against the majors, it is less evident among the emerging market currencies. The JP Morgan Emerging Market Currency Index is virtually flat since the start of the year, while the MSCI Emerging Market Currency Index that puts more weight in up a little more than 0.25%.
