Another quiet day in Asia ahead of Fed Governor Yellen’s speech in Jackson Hole. The USD has moved asymmetrically in last 24 hours. Rallying against some pairs and falling against other. Today we take a look at some of the most “interesting” moves and ponder whether positioning, Jackson Hole or other “forces” are at play.
The degree of resurgence very much depends on against what. It has had a very strong run in the last few days against oil, precious metals and commodities in general. A reasonably strong rally against Emerging Market currencies today, a negligible rally against most G10 and continues to fall against GBP and NZD.
From a technical perspective, it has made some significant inroads into some of the above that we will look at shortly. The question here is, does this mark a period of renewed USD strength? Or is this just a “faux” rally ahead of Yellen’s speech driven by position squaring? The honest answer here is I doubt anyone truly knows. Certainly not me.
My instinct tells me this is positioning squaring but until the details of the speech come out I don’t feel there is a lot of point getting tied up in conjecture. I won’t tie myself up in knots second-guessing the will she/won’t she, hawkish/dove, wax on/wax off; I will prefer to observe the post-speech price action. That will tell the truth.
Nevertheless, some of the divergent short term price action makes for compelling viewing…
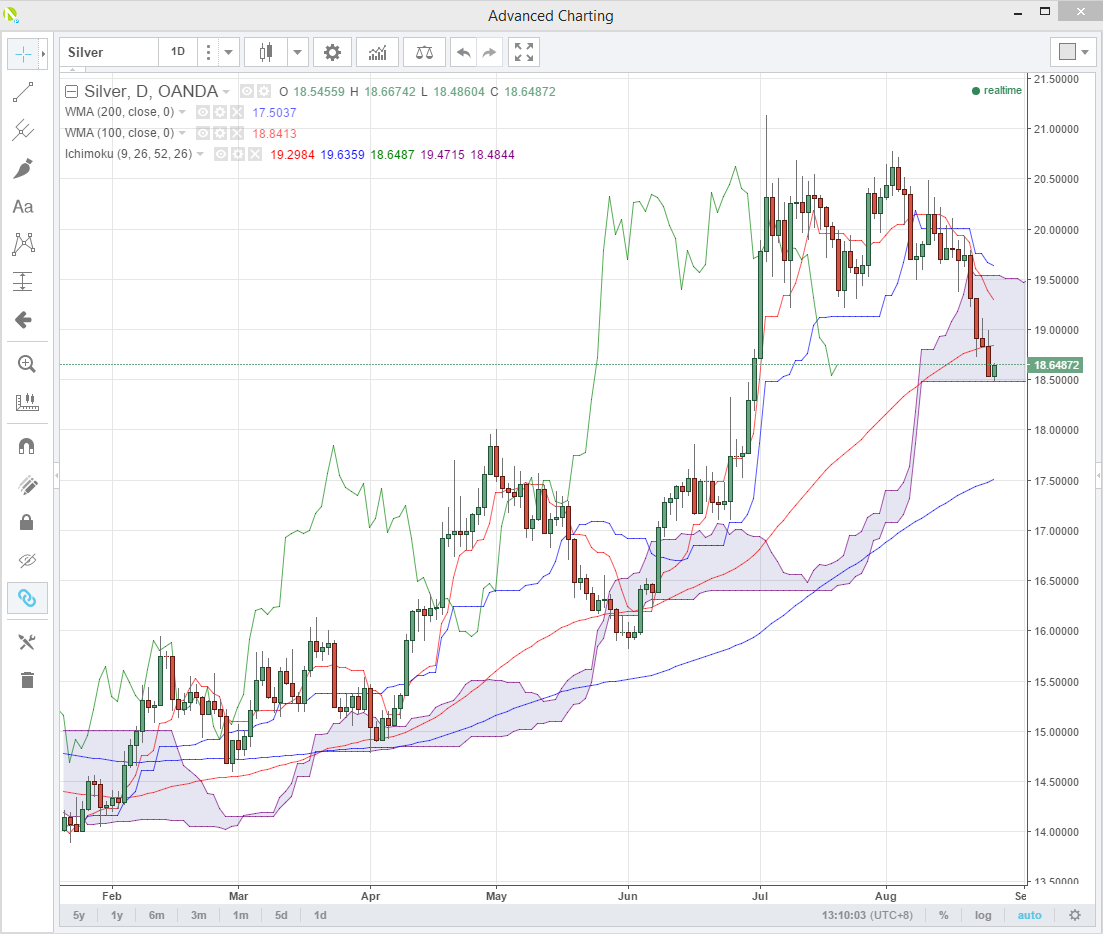
Broke the 100 DMA at 18.8400 and this becomes resistance. Treading water above support at 18.4850 the bottom of the daily cloud. A break here opens up a move to 17.5000 the 200 DMA and a series of daily highs. This level is important as it marked the start of the initial breakout upwards.
A hawkish Yellen speech, on the basis of this technical setup, opens a potentially ugly move down. There are still a lot of long Silver positions out there, mostly at levels near 19.5000/20.0000. To paraphrase that great Master, Yoda, “we may have to unlearn what we have learnt.”
PLATINUM
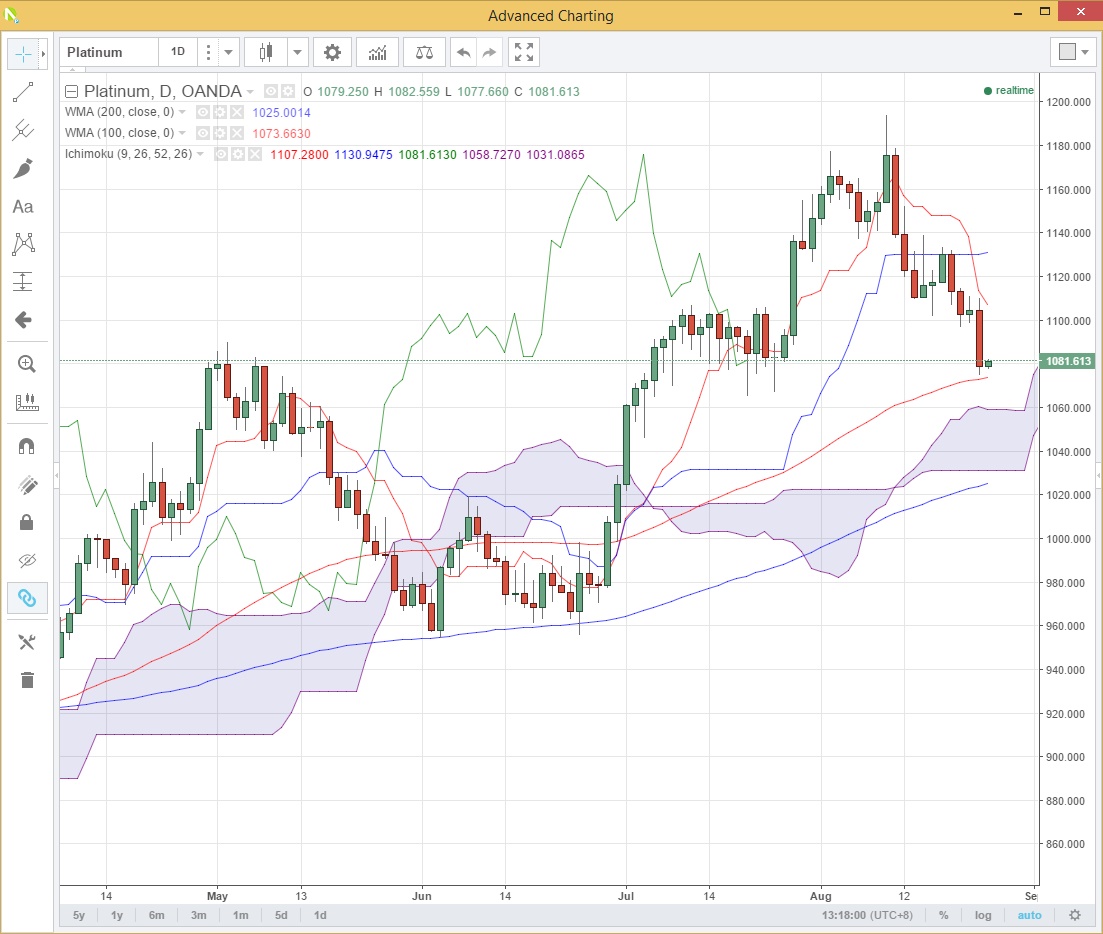
My beloved inverse head and shoulders here has been well and truly invalidated. The article is here Platinum Higher?
Platinum is marking time as well above the 100 DMA at 1073.65. Next support is at 1058.70 the top of the daily cloud.
Resistance is at 1103.00, a series of daily highs back to early July and the breakout point once again of the last rally.
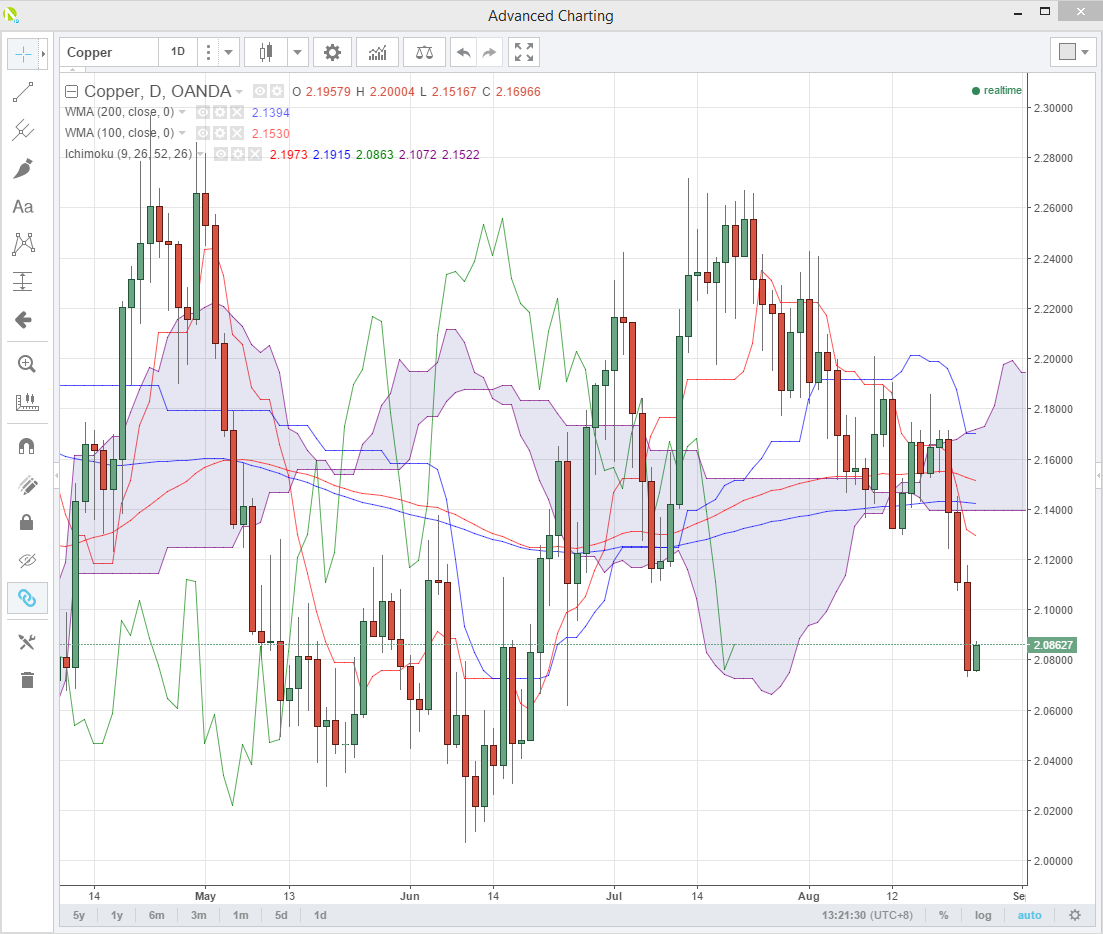
Supply overhangs continue to weigh here, and it’s not been a happy week for mining shares.
The chart points to a move to June lows at 2.0200 if 2.0760 breaks and closes under here.
Topside resistance is solid now between 2.1400and 2.1700. This contains both sides of the Ichi Moko cloud and the 100 and 200 DMA’s.
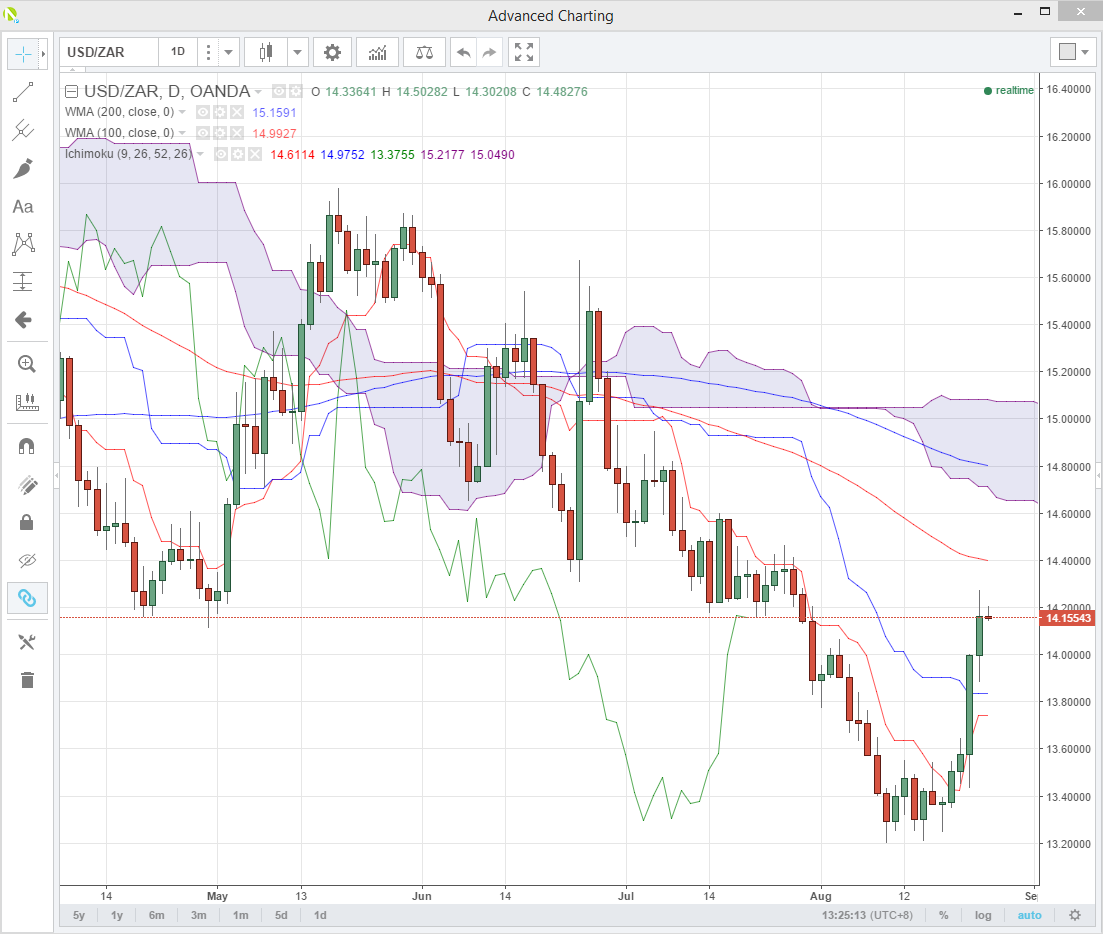
The Rand continues to get slammed as the fallout I spoke about yesterday continues. The latest is the Finance Minister is simply refusing to attend the police interview Thursday! Yesterdays story South African Rand Slammed
We are approaching important daily resistance at 14.2000 area, and a break sets us up for a test of the 100 DMA at 14.4000. I said yesterday USD/ZAR will be driven by politics going forward but a hawkish Yellen will no doubt add fuel to the fire.
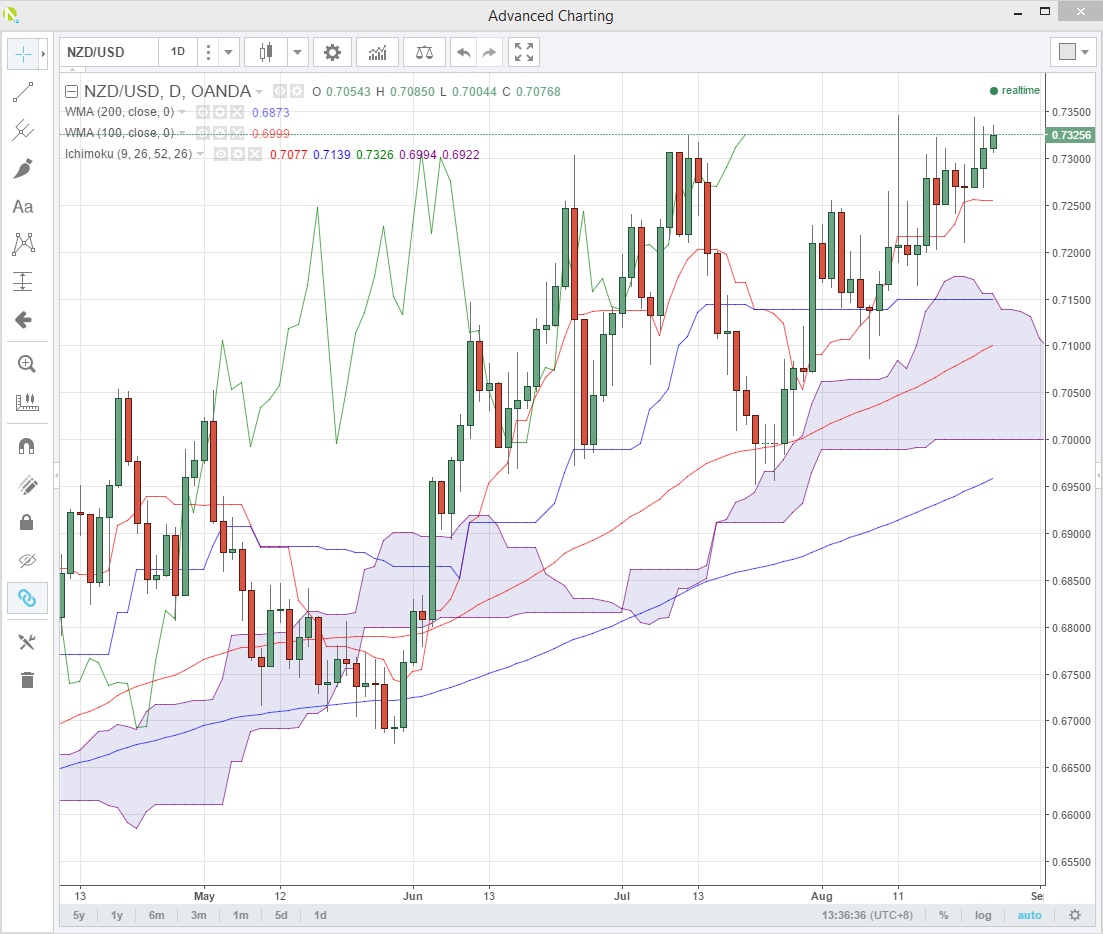
Fonterra, New Zealand’s largest exporter, upgraded their Milk Payout forecast to farmers this morning. This matters as dairy makes up some 20% of New Zealand’s exports. When Fonterra sneezes, New Zealand catches a cold and vice versa.
This gave an extra fillip to the NZD which continued its march higher against the USD and bucking the overall trend. We have broken resistance at 7305 now, and this sets the Kiwi up for a move to 7450/7500 area. Expect more rhetoric from the RBNZ now vis a vis the level of the Kiwi.
No doubt there is much gnashing of the teeth in frustration at RBNZ HQ, as their efforts to talk the currency down fail dismally. As I have said previously, New Zealand’s status as one of two remaining creditworthy G20’s with an actual positive yield, mean any sustained selloff of the NZD is will difficult to maintain. With the surprise Fonterra upgrades in the milkshake, this just got a lot harder.
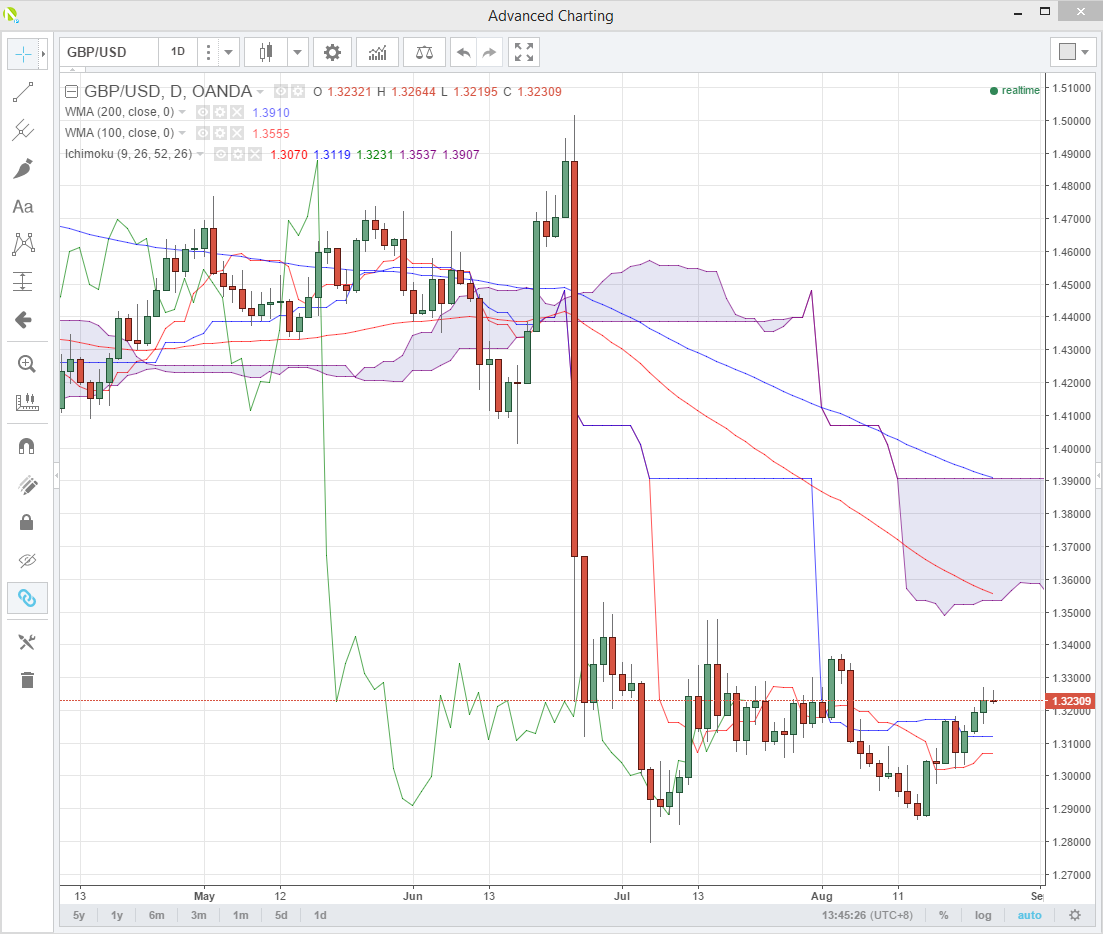
The British have always marched to their own plucky beat, and the currency is certainly doing the same. Much like the NZD/USD above. In the big picture, GBP/USD has traded 1.2850/1.3350 since Britain chose to fight Europe on the beaches, etc in July.
With a huge amount of short positioning out there GBP has not managed to make a new low since Brexit Day. The absolute low around 1.2800 remains comfortably unchallenged. Resistance at 1.3350 is not to far away and a daily close above set up the potential for a nasty short squeeze.
The price action will tell the story, but the outcome will not be dictated to by whether Ms Yellen is yellin’ or bellin’.
Summary
The USD rally is asymmetric. Showing itself more strongly against some, neither here nor there against others and being totally ignored against other pairs still! One suspects that the amount of short-term positioning out there is the underlying driver of the magnitude of these moves. The need to reduce risk and positioning ahead of the Jackson Hole speech causing much “unlearning of what we have learnt.”
Whether some of these moves continue will depend on the content of the speech and as such, patience is a virtue here.
