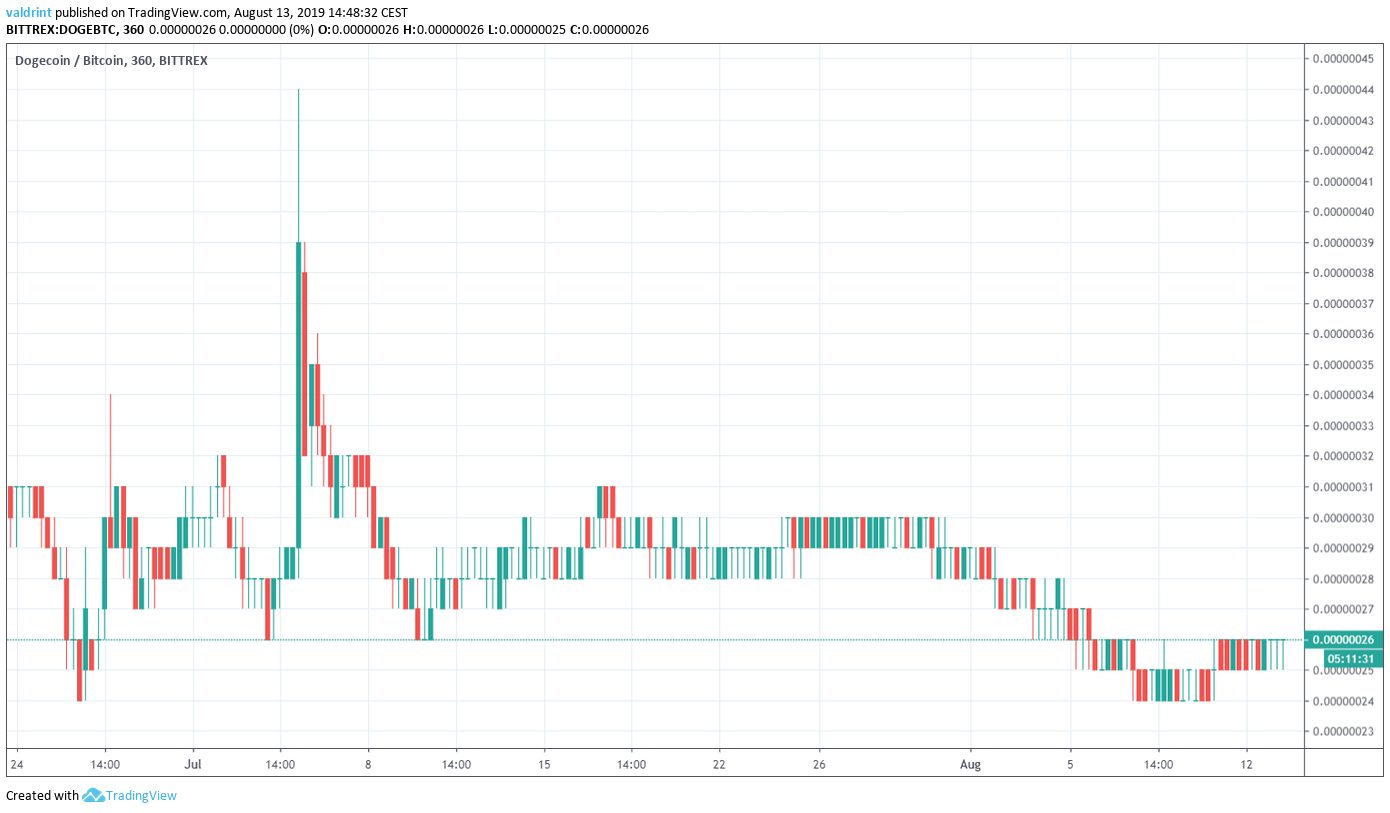
On June 25, 2019, the Dogecoin price reached a low of 25 satoshis. An upward move ensued. On July 5, it reached a high of 25 satoshis. It has been decreasing since. On August 8, the DOGE price again reached a low of 25 satoshis — creating a double bottom pattern.
At the time of writing, it was trading at 26 satoshis.
Will the DOGE price begin another move or are there further decreases in store? Continue reading if you are interested in finding out.
Dogecoin Price: Trends and Highlights for August 13
Long-Term DOGE Price Support
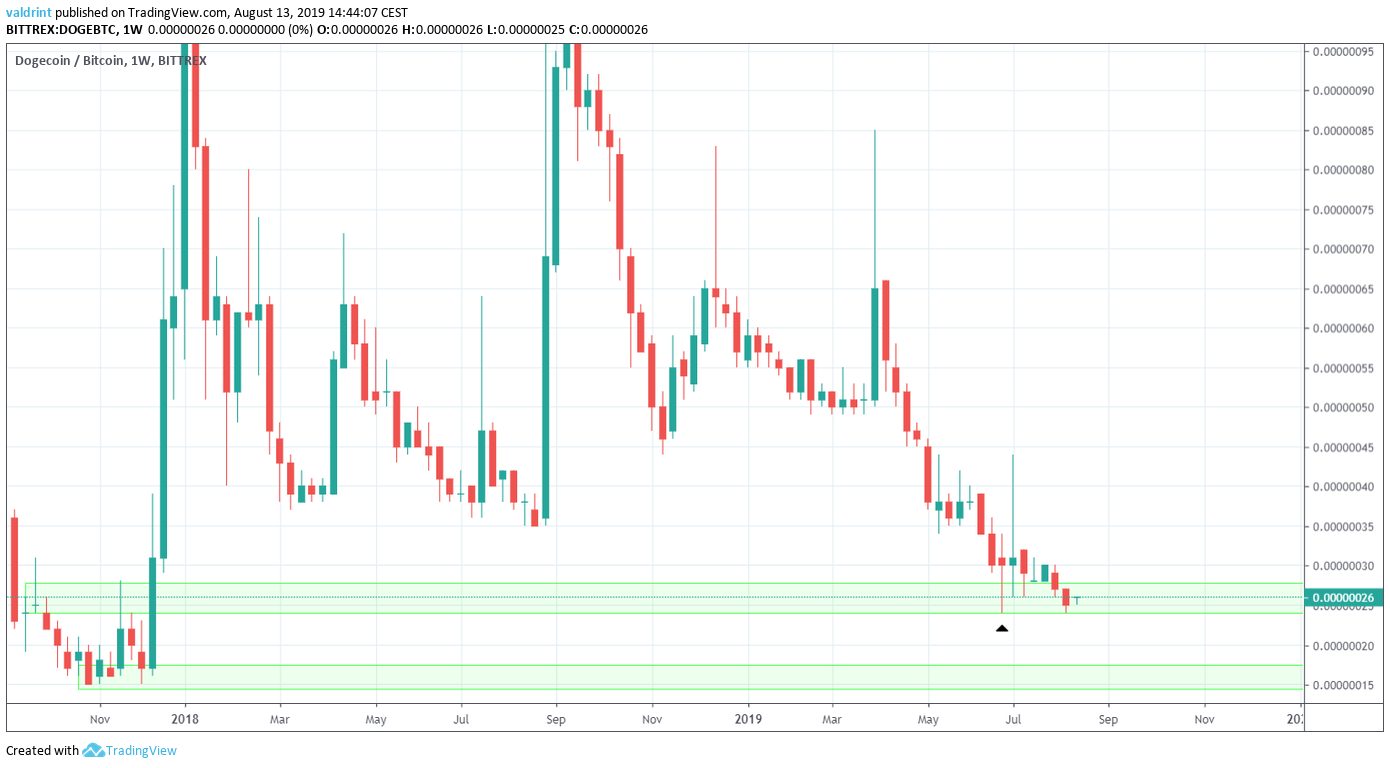
A look at the weekly time-frame shows that DOGE has reached a significant support area.
The significance of this area is reiterated by the long lower wick of the price once it reached this area.
If it fails to hold the price, the next one can be found at 15 satoshis.
Will the DOGE price get there?
Descending Channel
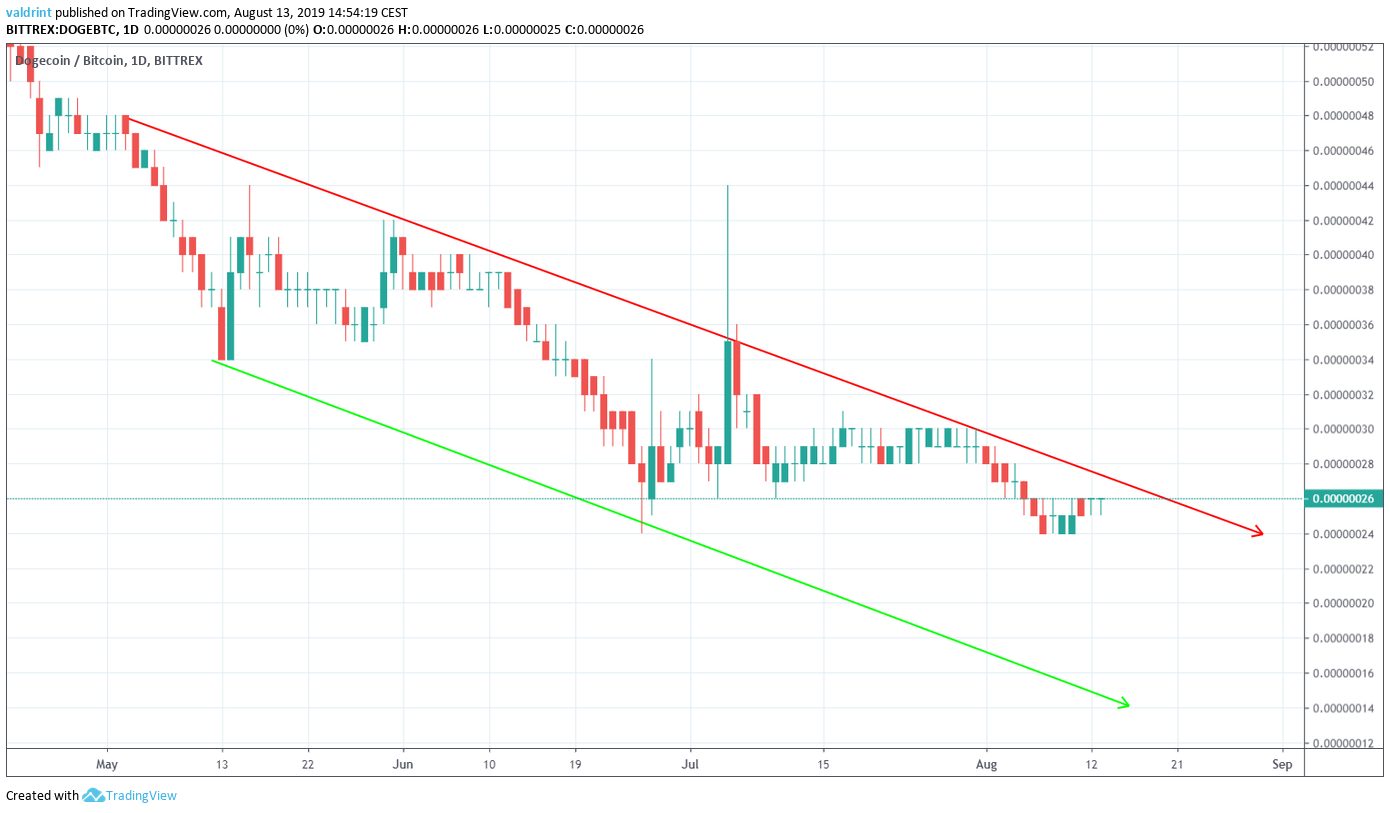
A look at the daily time-frame shows that Dogecoin has been trading inside a descending channel since the beginning of May.
At the time of writing, the DOGE price was trading very close to the support line.
Inside this channel, there are two developments that I think are interesting.
- The double bottom on June 25 and August 8.
- The unsuccessful breakout attempt on July 30.
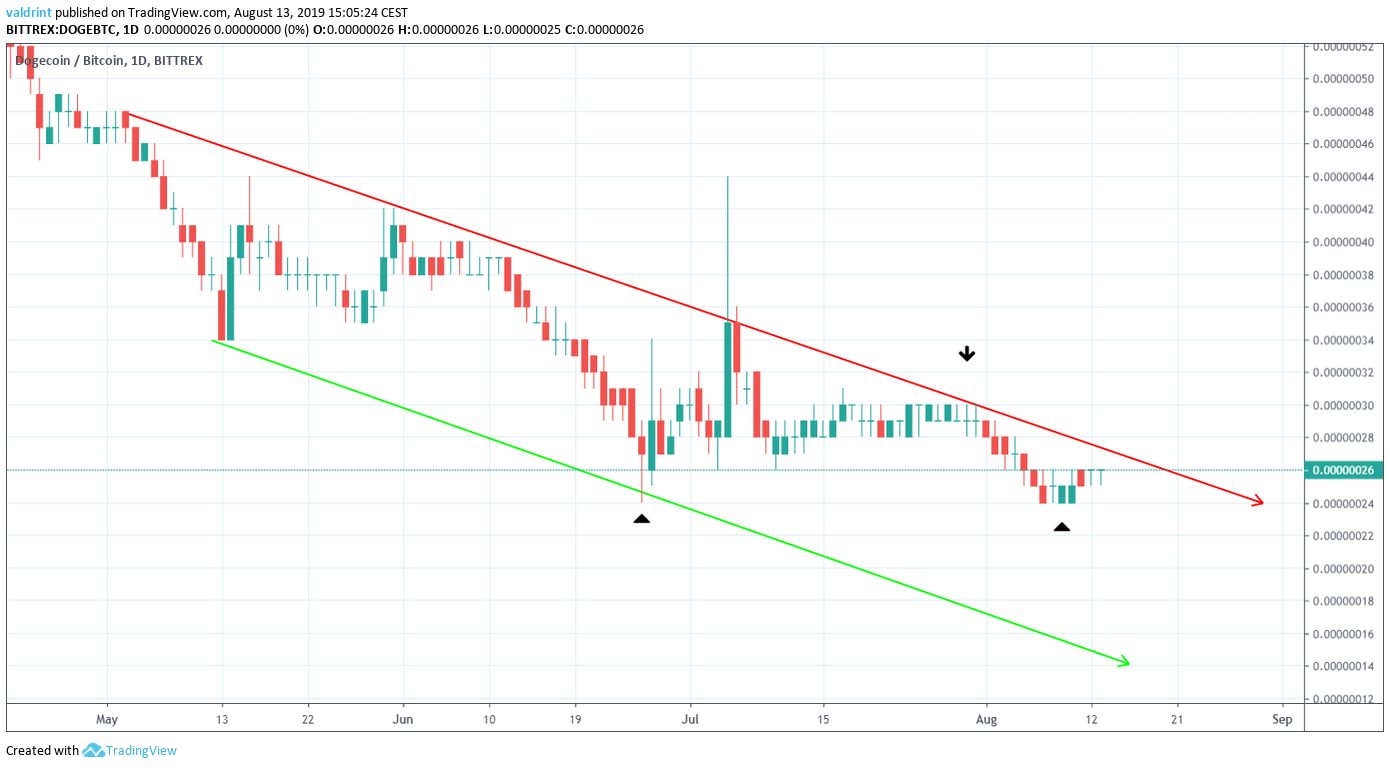
After the breakout attempt, DOGE began to decrease.
Instead of reaching the support line, it made a double bottom on August 7-10.
Afterward, it increased slightly.
This double bottom gains more significance since it is occurring inside a significant support area, which we discussed in the first section.
Additionally, it was accompanied by bullish divergence in the RSI.
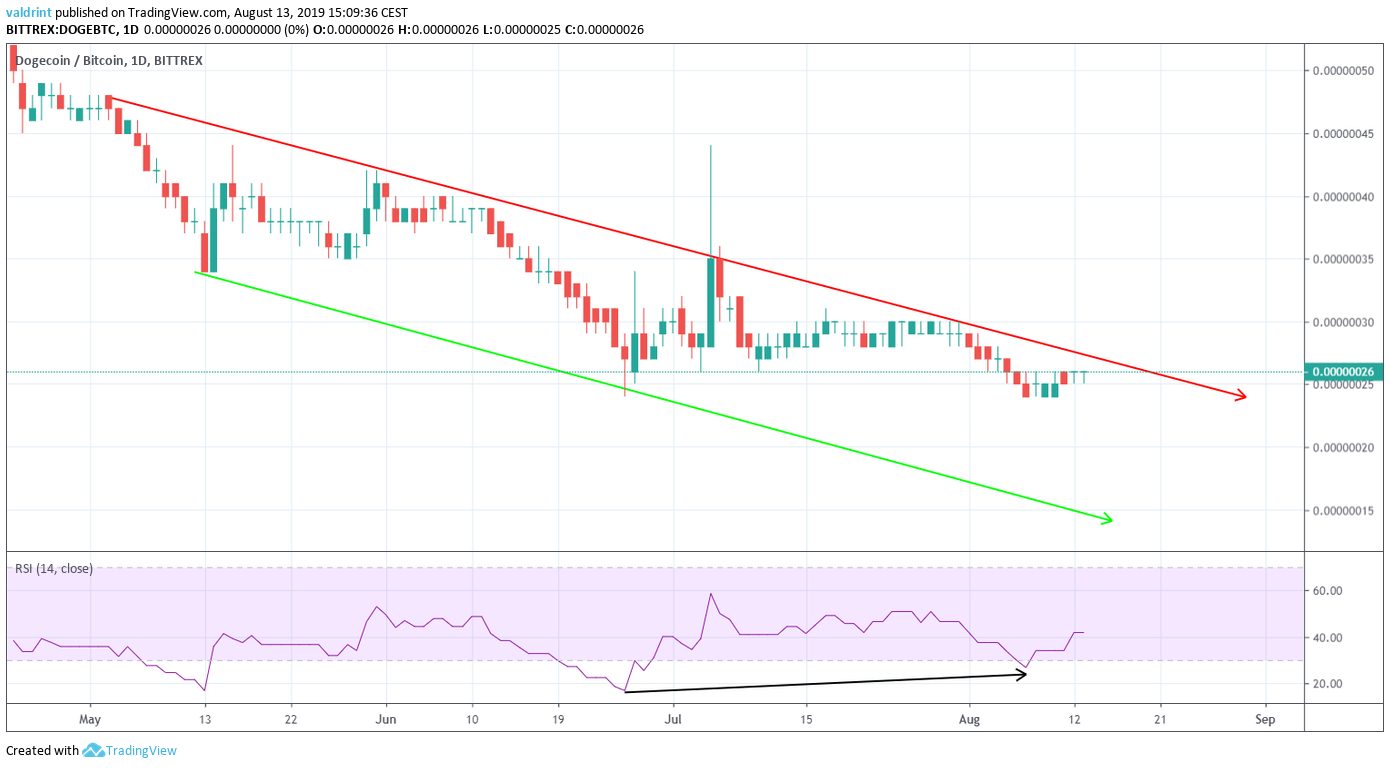
This makes us believe that the DOGE price will not decrease towards the support line, but rather will break out.
Resistance Areas
If it breaks out, one resistance area is outlined below.
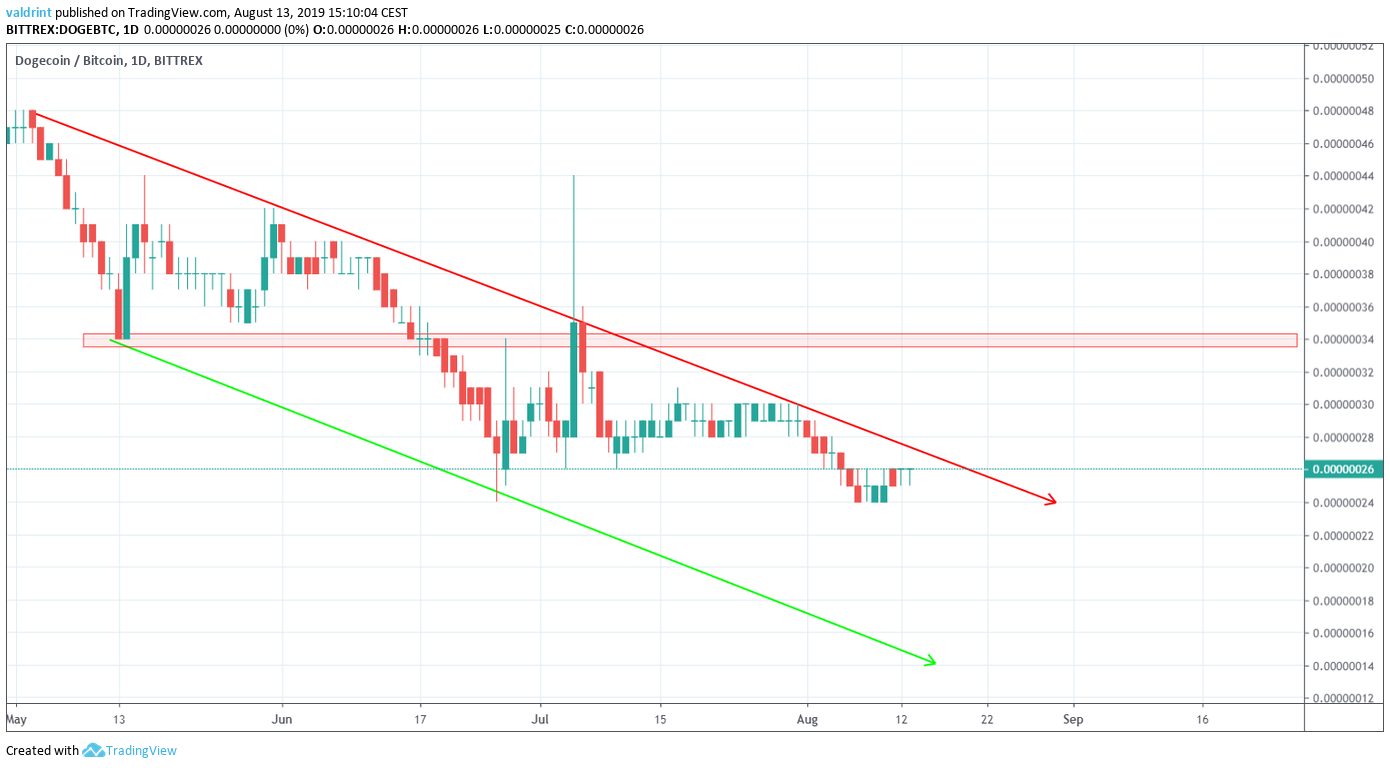
It is found at 34 satoshis.
We believe that the Dogecoin price will eventually reach it.
Dogecoin Price Summary
The Dogecoin price is trading inside a descending channel.
According to our analysis, it is likely to break out and reach the resistance area outlined above.
