Of course taxation correlates to economic growth. One could generalize and say the higher the tax rate, the slower the growth. Yet this belief is too simplistic to be a litmus test for economic decisions.
- The USA must compete against the global economies – and lower tax rates in a trading partner push the economic advantage towards the trading partner;
- A more reasonable question may be what one considers “economic growth”. The 0.1% may believe economic growth is monetary based, while the 99.9% may think the primary test of growth is if they have a job;
- Why tax at all at the Federal level? The government can print all the money it needs. It should be obvious to most economic observers that the USA printed $3 trillion dollars (see Fed balance sheet) – and the dollar did not collapse and inflation did not raise its ugly head. However, this is a discussion for another day;
- Taxation works the best when activities which create a strong economy are taxed little, while activities which are deemed socially unacceptable or potentially weakening the economy (such as alcohol) are taxed more.
To answer the open question – does the USA tax its citizens too much relative to its trading partners – the answer likely is no.

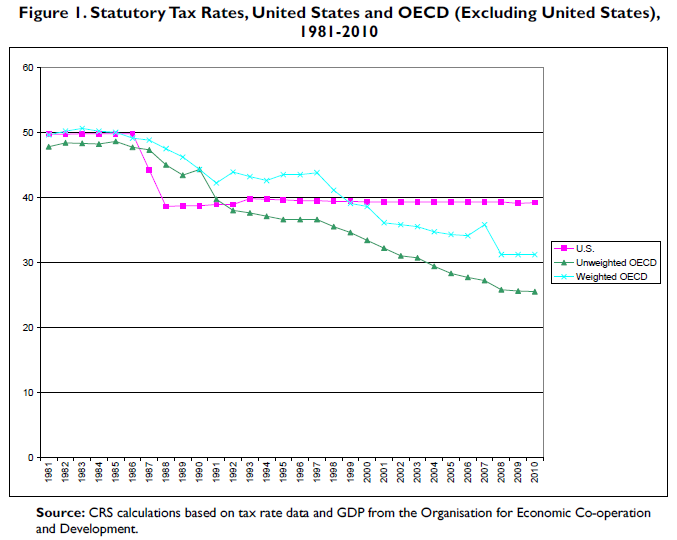
It is the taxes business pays that are important in a globalized economy. The USA corporate tax rates are above most other trading partners (FAS study).

There are a couple of issues with the above graphic as it does not show the effective tax rate (the rate of tax after deductions and credits). Another issue with the graph is that it does not show the effective tax rate on exported products. China rebates most of the tax collected to its exporters. China even has an incentive for a company to be a “pure exporter”.
Although the nature of China’s subsidies has always been murky, an issue that the US, the EU, Canada and other countries have repeatedly raised at the WTO over the last decade, it is not widely appreciated that several of these subsidies are conditional on firms exporting all or the majority of their output. These are what we would call ‘pure-exporter subsidies’.
Products and services provided to USA citizens are subject to global competition. Many miss that because of the internet – call centers, research and development, design, and administrative functions can be performed anywhere in the world. Taxing business exports employment overseas.
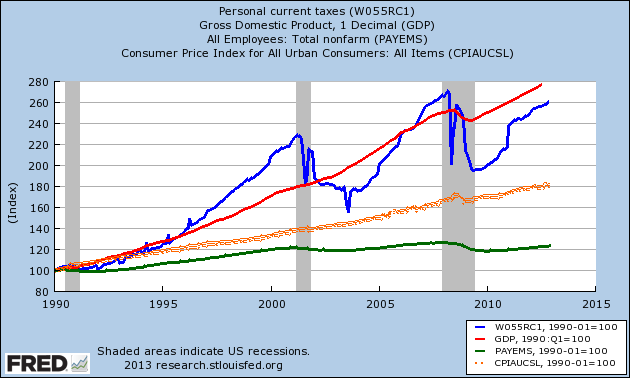
Comparing USA Personal Tax Growth (blue line), GDP (red line), Inflation (orange dotted line), and Jobs (green line)

Job growth should be the primary litmus text in taxation.
Other Economic News this Week:
The Econintersect economic forecast for February 2012 continues to show weak growth. The underlying dynamics have a whiff of improvement – but the zinger in the data was a supply chain contraction. However all the recession markers have evaporated, and one of our alternate methods to validate our forecast remains recessionary (but still only slightly so). Basically, we are saying that not enough products (crude, intermediate, and finished) were moved for sales or manufacture in February.
ECRI now believes a recession began in July 2012. ECRI first stated in September 2011 a recession was coming . The size and depth is unknown. The ECRI WLI growth index value has been weakly in positive territory for over three months. The index is indicating the economy six month from today will be slightly better than it is today.
Current ECRI WLI Growth Index

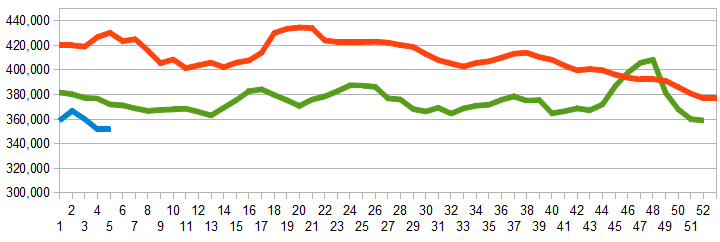
Initial unemployment claims fell from 335,000 (reported last week) to 368,000 this week. Historically, claims exceeding 400,000 per week usually occur when employment gains are less than the workforce growth, resulting in an increasing unemployment rate (background here and here).
The real gauge – the 4 week moving average – rose marginally from 351,750 (reported last week) to 352,000. Because of the noise (week-to-week movements from abnormal events AND the backward revisions to previous weeks releases), the 4-week average remains the reliable gauge.
Weekly Initial Unemployment Claims – 4 Week Average – Seasonally Adjusted – 2010 (blue line), 2011 (red line), 2012 (green line)

Bankruptcies this Week: School Specialty, LodgeNet Interactive, Privately-held Eurofresh
Data released this week which contained economically intuitive components (forward looking) were:
- Rail movements (where the economic intuitive components indicate a moderately expanding economy).
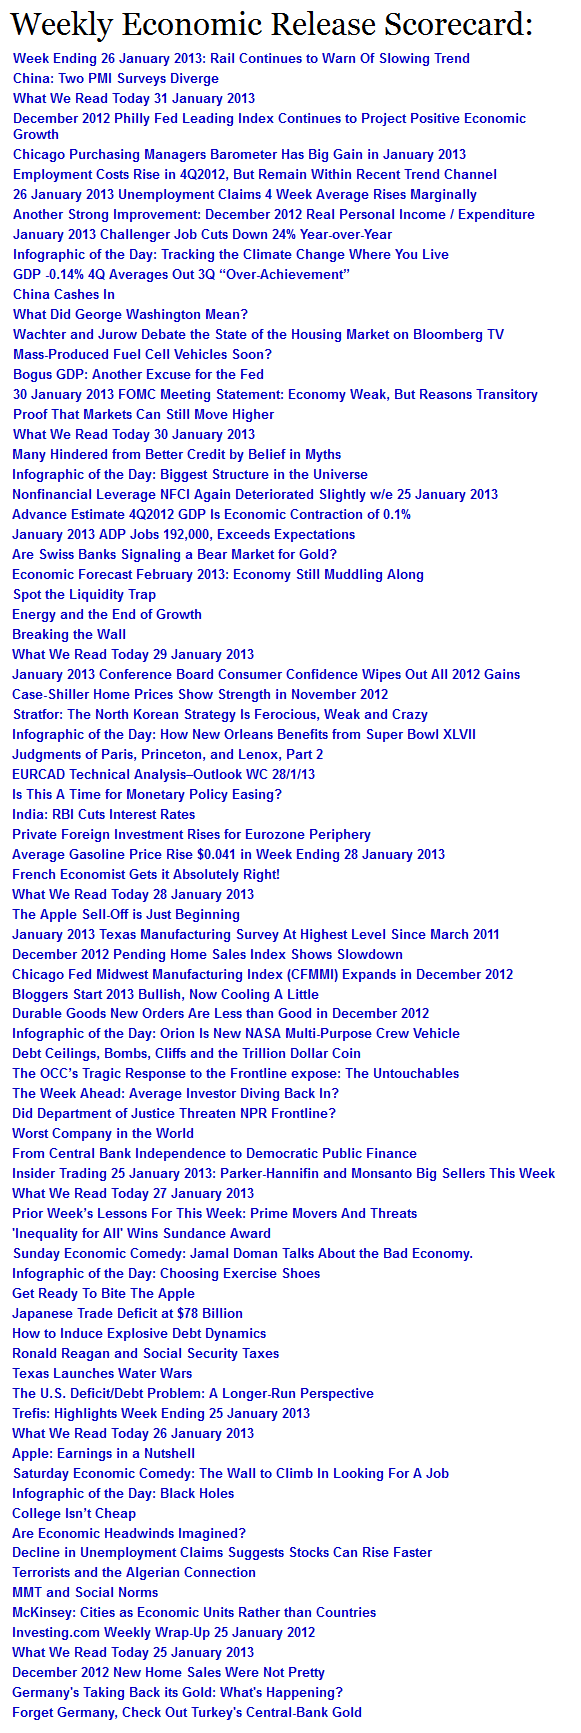
Weekly Economic Release Scorecard:
Click here to view the scorecard table below with active hyperlinks.

