Copper caught the attention of many short-term traders in October when it started higher off of a year-long bottom. It had a monster month, moving up 25% when the dust settled. The industrial metal paused, drifting sideways building a bull flag until June. More traders got involved as it started a second move higher. And now as the rally hits 1 year, copper is again showing signs of life. Does it have another round higher in it still?
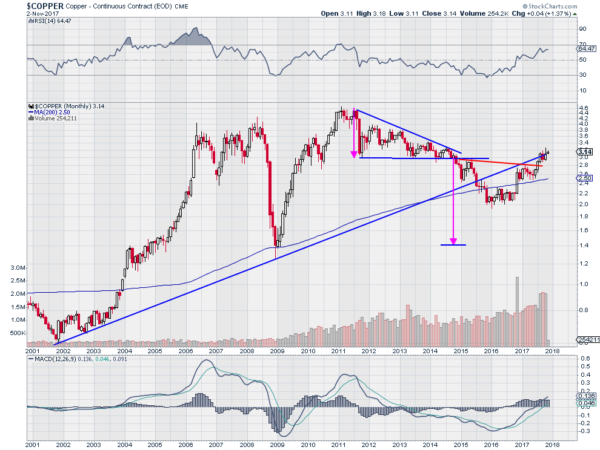
The chart below indicates that the path higher from here may be slow, stalled or even that it might pullback in the short run. The first indicator is the price stalling at the rising trend line that acted as support for 14 years before it broke down through it in 2015. Often a prior trend-break gets tested before resuming.
The second is the price stalling at the prior support of the descending triangle it broke in 2014. This is significant because of the time spent at this level and just above it in the past. The move over the last year went through price territory where there was very little price history. Less transactions mean less parties with an ax to grind at that level. Now there is a lot of price history to work through.

But there are also indications that the rally will sustain itself. The red trend line shows the neck of an Inverse head-and -shoulders pattern. When price broke above that it triggered a price objective to at least 3.80. The other is the momentum indicators. The RSI is rising and strong in the bullish zone. The MACD is also rising and positive. These support more upside price action.
There is a case to be made for copper to move higher or reverse. And perhaps that is why it is stalled at the moment as the players battle each other to see who wins. It would appear a move over 3.25 would give the win to the bullish case. And a break under 2.90 suggests that the bearish case has won. Until then, it's just a matter of time.
