Crude oil had an eventful session on Monday. It closed the opening gap and bulls built on their gains till the session’s close. On Tuesday, however, the price rolled over and headed south. Is all hope for higher oil lost? The bulls have proven to be quite tireless. Can they pull a rabbit out of their hats shortly?
Let’s take a closer look at the chart below:

chart courtesy of stockcharts.com
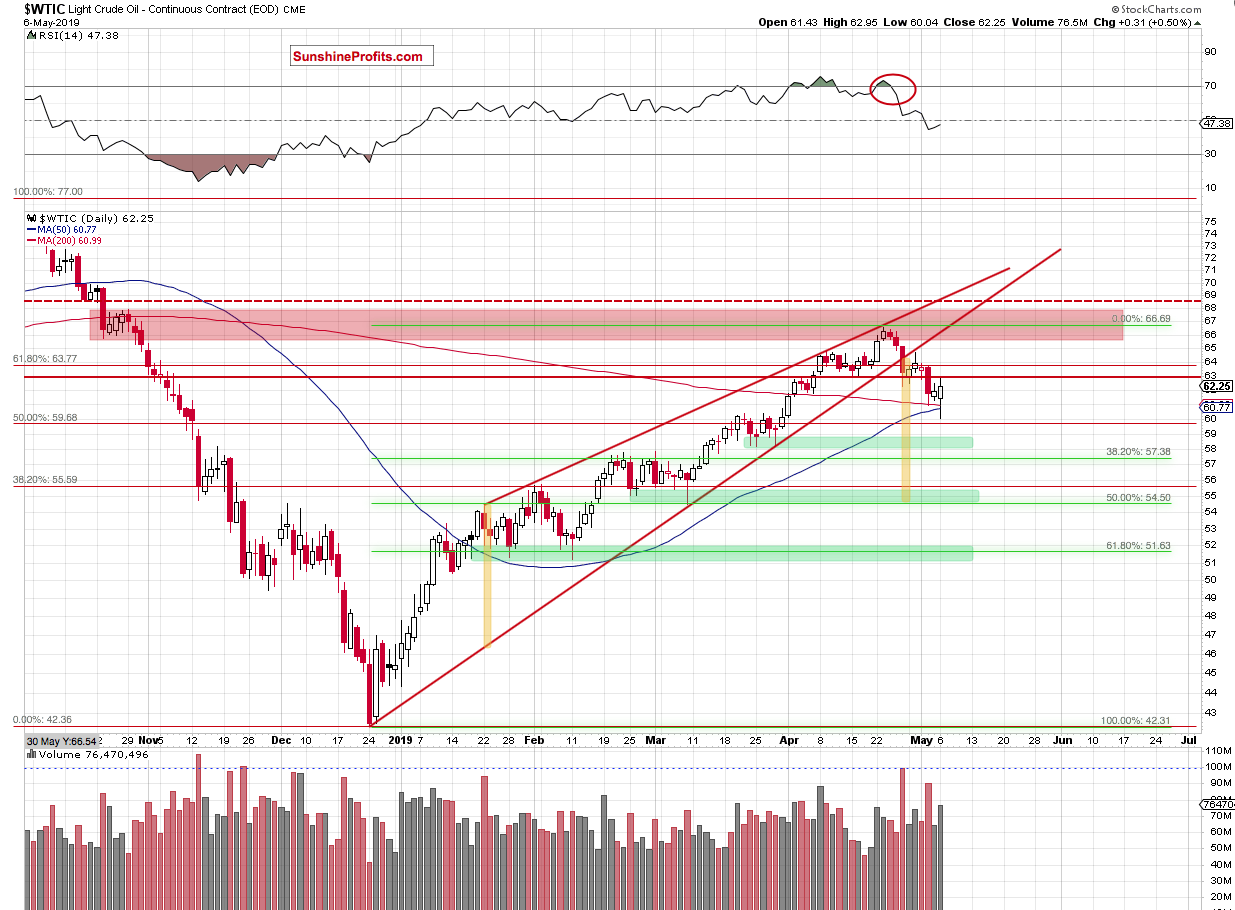
Monday’s session started with a sizable gapping move down that reversed later in the day. The gap has been closed as testing the 200- and 50-day moving averages encouraged buyers to act.
They’ve taken the commodity to almost $63 but the previously broken red horizontal resistance line (based on mid-April lows) stopped them. Such price action looks like verification of the earlier breakdown and suggests that another attempt to move lower may be just around the corner.
The daily indicators support such a scenario. They are free from any buy signals. Therefore, if oil moves down from here, we’ll likely see another test of the 200- and 50-day moving averages. Such a test would then be likely followed by a drop to the first green support zone or even the 38.2% Fibonacci retracement.
Summing Up
The outlook for oil remains bearish. Monday’s reversal of the gap brought higher prices but appears to be rolling over. This is what a verification of the breakdown below the red horizontal resistance line that’s based on mid-April lows looks like. There’re no buy signals on the daily indicators while the weekly ones remain on sell signals. The bearish divergences between the daily indicators and the oil price itself are getting their downward price resolution. The profitable short position continues to be justified.
Thank you.
