👀 Ones to watch: The MOST undervalued stocks to buy right nowSee Undervalued Stocks

Developed Market Flash PMI Explains U.S. 10-Year Bond Yield Fall

Published 08/26/2018, 12:16 AM
Updated 07/09/2023, 06:31 AM
US10YT=X
-

Another bond/macro chart, here's the flash composite DM manufacturing PMI against the US 10-year bond yield. The composite DM flash PMI (we construct it using Markit data and IMF GDP weights) dropped -0.5pts in August to a 14 month low of 54.2. Japan bucked the trend, up +0.2pts to 52.5, while the US dropped the most, down -0.8pts to 54.5 and Europe also down -0.5pts to 54.6. The chart is helpful in explaining why the upturn in bond yields has stalled, at least for now.

The initial turnaround in the DM composite PMI from near-recessionary conditions in early 2016 drove much of the initial push higher in yields. From here for yields to keep going higher we're going to need to either see a stable PMI and higher inflation or another tick up in the PMIs. Of course, if the PMI continues to fall it will provide weight to those outlining the bullish case, with many referencing the possible head and shoulders top in the 10-year bond yield.
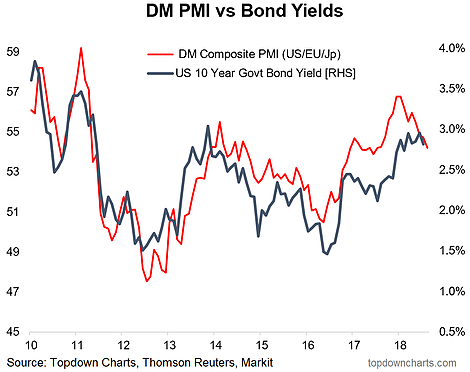
DM PMI Vs UST 10-Y Yields 2010-2018

Latest comments

Loading next article…
Risk Disclosure: Trading in financial instruments and/or cryptocurrencies involves high risks including the risk of losing some, or all, of your investment amount, and may not be suitable for all investors. Prices of cryptocurrencies are extremely volatile and may be affected by external factors such as financial, regulatory or political events. Trading on margin increases the financial risks.
Before deciding to trade in financial instrument or cryptocurrencies you should be fully informed of the risks and costs associated with trading the financial markets, carefully consider your investment objectives, level of experience, and risk appetite, and seek professional advice where needed.
Fusion Media would like to remind you that the data contained in this website is not necessarily real-time nor accurate. The data and prices on the website are not necessarily provided by any market or exchange, but may be provided by market makers, and so prices may not be accurate and may differ from the actual price at any given market, meaning prices are indicative and not appropriate for trading purposes. Fusion Media and any provider of the data contained in this website will not accept liability for any loss or damage as a result of your trading, or your reliance on the information contained within this website.
It is prohibited to use, store, reproduce, display, modify, transmit or distribute the data contained in this website without the explicit prior written permission of Fusion Media and/or the data provider. All intellectual property rights are reserved by the providers and/or the exchange providing the data contained in this website.
Fusion Media may be compensated by the advertisers that appear on the website, based on your interaction with the advertisements or advertisers.
© 2007-2024 - Fusion Media Limited. All Rights Reserved.