The program is back and Tuesday’s one day down day appears already long forgotten, but I want to follow up on a chart discussion I started Tuesday on the OEX and continue here with the DJIA.
Why? Because it’s all correlated and connected. The trend lines I mentioned in OEX is correlated with the DJIA. While OEX has made new all-time highs DJIA has not yet, indeed this week’s move to the upside appears currently (at the time of this writing) contained at a very specific point:

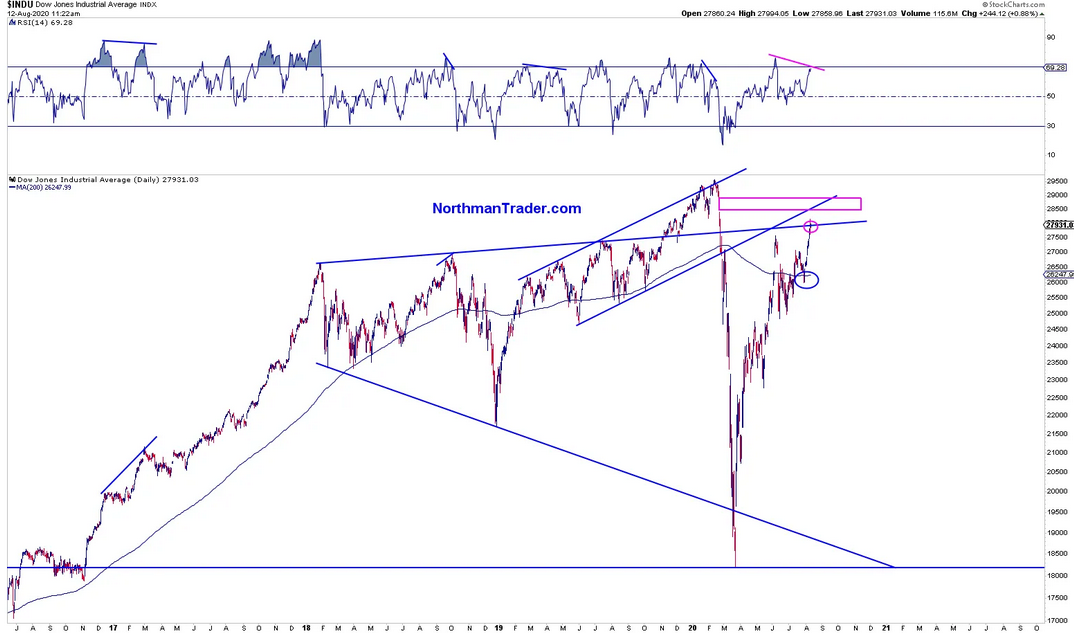
Note the trend line formed during 2018 and 2019 at each consecutive high, it then became support when the Fed went into full Repo mode in the fall of 2019 and led to the blow-off top in February. But then it broke below the trend during the Q1 crash.
Now after trillions of printing here we are again.
Indeed DJIA poked slightly above the trend line Tuesday before reverting back below the close. So this trend line matters and DJIA is again pressing against this trend line yesterday.
Should DJIA manage to push above this trend line on this run the next obvious upside risk is the February open gap for DJIA. Also, note there too is a trend line marking the lows of the corrections for 2019.
The February gap and the trend line together would suggest confluence resistance should DJIA get there so another 500-600 points or so higher from here.
But also note, not only has the DJIA gone vertical in recent days it is also making new highs on a negative divergence. In the past confirmed negative divergence have led to corrections of size. In case that happens the 200MA is now important support and corrections may be limited to there, but watch out, a sustained move below the 200MA would put DJIA squarely back inside the larger structural pattern and then everything is back on the table.
Lest not forget DJIA gave back nearly 4 years of gains in just 4 weeks earlier this year.
While eternal central bank support appears to be in full control of markets at this stage a normalization of the valuations equation, if not supported by presumed future above-par growth, could lead to a sudden realignment of high forward multiples.
Bottom line:
DJIA is at a key juncture here. Upside risk is into the upper gap and trend line, the immediate downside risk is a revisit to the 200MA, failing that DJIA has a number of open gaps to contend with that are much lower, one of note being an open gap just below 25,000, but that’s a discussion to be had if and when that time comes.
