I’m a real lover of technology stocks from the old-tech economy. Most of the big players of the first wave of the internet boom are worth billions and started to pay dividends recently. They still have huge potential to hike dividends and billions of cash on their balance sheets.
Last Friday, I purchased 50 shares of the networking and communication devices giant Cisco Systems. My total purchase amount was around USD 1,300 bucks and will produce approximately 33 bucks in dividend income at a 2.6 percent dividend yield. The current P/E of Cisco is acceptable in my view at 14.55 and 12.41 for the next year. Remember there are forecasts of growing earnings per share of 5 percent for the next half decade. With a payout of 30 percent or so, it’s a great opportunity for long-term dividend growth investors. I weighted the stock with 1.21 percent in my Dividend Yield Passive Income Portfolio.


Cisco designs, manufactures, and sells Internet protocol (IP) based networking and other products related to the communications and information technology industries worldwide. It offers switching products, including fixed-configuration and modular switches, and storage products that provide connectivity to end users, workstations, IP phones, access points, and servers, as well as function as aggregators on local-area networks and wide-area networks; and routers that interconnects public and private IP networks for mobile, data, voice, and video applications.

For readers who a new to the matter and my dividend growth philosophy: I funded a virtual portfolio with 100k on October 4, 2012 with the aim to build a passive income stream that doubles each five to ten years. I plan to purchase each week one stock holding until the money is fully invested. The total number of constituents is expected at 50 – 70 companies and the dividend income should be at least $3,000 per year.
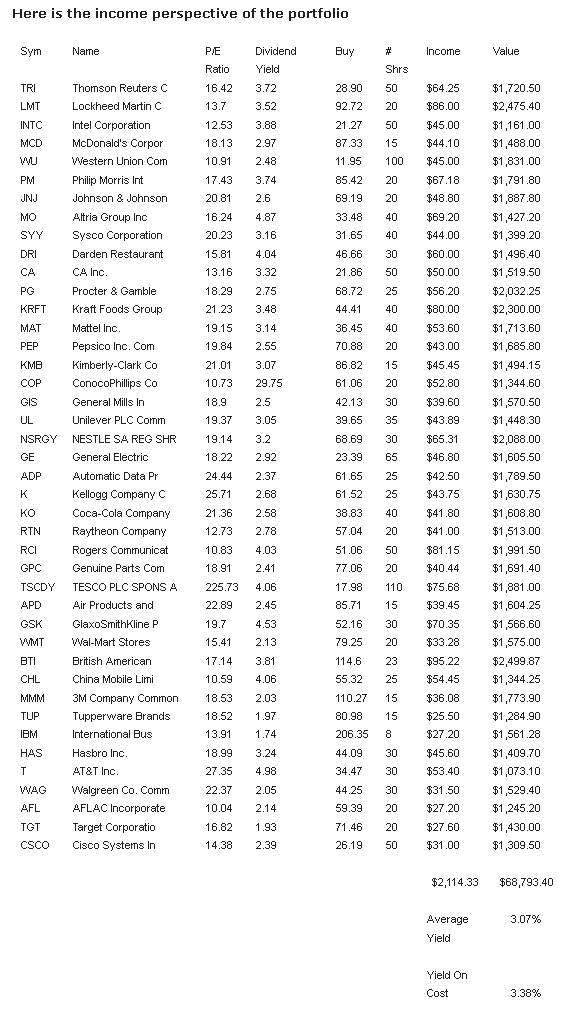
The full year dividend income of the portfolio is now estimated at USD 2,114.33. I paid around 67k for all these 42 stockholdings combined and paid 225 bucks in total for transaction fee. The yield on cost amounts to 3.33 percent. Due to the capital gains of the stocks, the current portfolio yield is at 3.09 percent.
With USD 38,749.50 deposited cash on bank, it’s still easy to reach a 3k dividend income by the end of the year if I buy each week a stock with a yield on cost of more than 3 percent. The Cisco share does not fulfill this criterion but my average dividend income is still high enough to keep this aims alive.
Stocks from the income vehicle are up 10.25 percent in average since the date of funding. The performance is an underperformance compared to the major indices like Dow Jones or S&P 500. This is reasonable to the slow purchasing process. I buy each week only one stake with 1-2 k. In markets with strong forces of the bulls, the strategy will lose performance.


Last Friday, I purchased 50 shares of the networking and communication devices giant Cisco Systems. My total purchase amount was around USD 1,300 bucks and will produce approximately 33 bucks in dividend income at a 2.6 percent dividend yield. The current P/E of Cisco is acceptable in my view at 14.55 and 12.41 for the next year. Remember there are forecasts of growing earnings per share of 5 percent for the next half decade. With a payout of 30 percent or so, it’s a great opportunity for long-term dividend growth investors. I weighted the stock with 1.21 percent in my Dividend Yield Passive Income Portfolio.


Cisco designs, manufactures, and sells Internet protocol (IP) based networking and other products related to the communications and information technology industries worldwide. It offers switching products, including fixed-configuration and modular switches, and storage products that provide connectivity to end users, workstations, IP phones, access points, and servers, as well as function as aggregators on local-area networks and wide-area networks; and routers that interconnects public and private IP networks for mobile, data, voice, and video applications.

For readers who a new to the matter and my dividend growth philosophy: I funded a virtual portfolio with 100k on October 4, 2012 with the aim to build a passive income stream that doubles each five to ten years. I plan to purchase each week one stock holding until the money is fully invested. The total number of constituents is expected at 50 – 70 companies and the dividend income should be at least $3,000 per year.
The full year dividend income of the portfolio is now estimated at USD 2,114.33. I paid around 67k for all these 42 stockholdings combined and paid 225 bucks in total for transaction fee. The yield on cost amounts to 3.33 percent. Due to the capital gains of the stocks, the current portfolio yield is at 3.09 percent.
With USD 38,749.50 deposited cash on bank, it’s still easy to reach a 3k dividend income by the end of the year if I buy each week a stock with a yield on cost of more than 3 percent. The Cisco share does not fulfill this criterion but my average dividend income is still high enough to keep this aims alive.
Stocks from the income vehicle are up 10.25 percent in average since the date of funding. The performance is an underperformance compared to the major indices like Dow Jones or S&P 500. This is reasonable to the slow purchasing process. I buy each week only one stake with 1-2 k. In markets with strong forces of the bulls, the strategy will lose performance.


