PPG Industries (N:PPG) is the global leader in the coatings industry. The company’s two largest competitors are:
Together, the 10 largest coatings companies control over 50% of the industry globally. The coatings industry is quickly consolidating as the largest players acquire smaller players.
This trend has picked up in recent years, as low oil and metal prices have reduced input costs for paint, creating higher margins (and more cash flows) for PPG Industries.
PPG Industries was founded in 1883 when Captain John Ford and John Pictairn started Pittsburgh Plate Glass Company. Today, PPG Industries has a market cap of $25.9 billion and has paid increasing dividends for 43 consecutive years.
The company splits its operations into 3 segments. The percentage of total income through the first 6 months of fiscal 2015 for each segment is shown below:
- Performance Coatings generates 54.1% of company income
- Industrial Coatings generates 40.5% of company income
- Glass generates 5.4% of company income
The Glass segment is by far the company’s smallest. It supplies flat glass and continuous strand fiber glass products to its customers.
The Industrial Coatings segment is one of PPG Industries’ two large segments. It provides coatings, finishes, adhesives, and sealants primarily for the industrial, packaging, and automotive industries.
PPG Industries largest segment is its Performance Coatings segment. The segment provides coatings, finishes, adhesives, and sealants for the aerospace, marine, and architectural industries.
Competitive Advantage
With its 4+ decade streak of continuously rising dividends, PPG Industries clearly has a strong and durable competitive advantage.
The paint industry has very favorable economics. It has high margins and requires little capital investment; it generates a lot of cash.
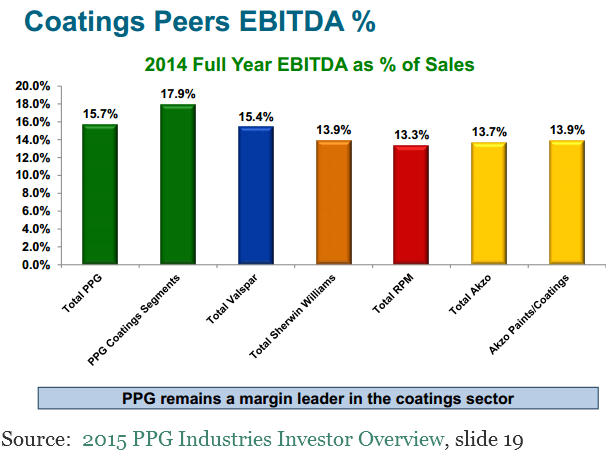
PPG Industries has the highest margins in the industry of any major player.

Through the first 6 months of 2015, the Performance Coatings segment has an operating margin of 14.5%, while the Industrial Coatings segment had an 18.3% operating margin. The Performance Coating segment generates the majority of its sales from lower margin (as compared to specialty purpose paints) architectural paint sales.
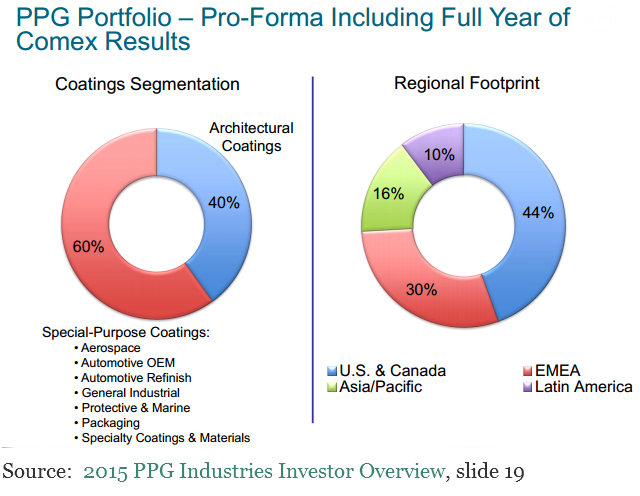
The company generates high margins through its large specialty purpose coatings sales. About 60% of revenue will come from specialty purpose coatings for PPG Industries in 2015.

Growth Potential
PPG Industries does not have high margins by accident. The company’s management has been systematically and purposefully selling lower margin business units and acquiring higher margin coatings businesses.
Recent divestitures include:
- Sale of commodity chemical business to Georgia Gulf Corporation in 2013 for $900 million
- Sale of sunlens business to Esillor International (OTC:ESLOY) in 2014 for $1.7 billion
PPG Industries currently generates 94.6% of its income from the coatings industry. The company still owns its lower margin Glass segment. I would not be in the slightest bit surprised if PPG Industries were to divest this segment as well in the future to focus exclusively on coatings.
With its significant cash flows and industry leading size, PPG Industries is well positioned to continue consolidating the global coatings industry.
The company has completed 2 large acquisitions in the last 2 years:
- In 2013 PPG Industries acquired Akzo Nobel’s North American coatings business for $1.05 billion.
- In 2014 PPG Industries acquired Comex’s Latin America business for $2.3 billion.
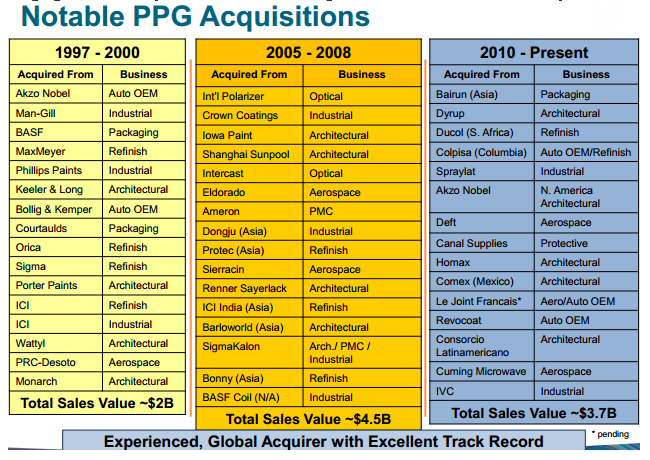
These are the company’s two largest recent acquisitions. PPG Industries has engaged in many other smaller acquisitions over the last 18 years.

You will notice that all acquisitions since 2008 have focused exclusively on the coatings industry.
Going forward, PPG Industries growth plans revolve around continued acquisitions in the coatings industry. The company can also grow its architectural coatings sales organically by building out its North American stores.
Sherwin Williams has over 4,000 stores in North America, while PPG Industries has less than 1,000 stores globally. The company has a substantial long-term growth runway ahead by slowly building out its company-owned stores.
Over the last decade, PPG Industries has compounded earnings-per-share at 9.8% a year. Income oriented investors have likely been less enthusiastic about the company’s above average earnings-per-share growth… The company has compounded dividends at just 3.9% a year over the last decade – far lower than earnings-per-share growth.
With a (largely justified) continued focus on acquisitions, I expect PPG to continue increasing its dividends slower than overall earnings-per-share growth as the company tries to keep as much cash on hand as possible to fund further acquisitions. This means further declines in the company’s payout ratio.
PPG Industries management’s target is to return around 40% of cash flows to shareholders through share repurchases and dividends. The company currently has a payout ratio of around just 25% (down from ~50% in 2005). Over the past decade, the company has returned about as much cash to shareholders through share repurchases as through dividends.
I expect the dividend payout ratio to hover around 20% to 25% for PPG Industries over the next few years, and for the company to return 15% to 25% of cash to shareholders through share repurchases.
PPG Industries currently has a dividend yield of 1.5%. I expect the company to grow earnings-per-share at between 9% and 11% a year over a full economic cycle, in line with historical growth. Together, growth and dividends give PPG Industries an expected total return of between 10.5% and 12.5% a year.
With its low yield and low historical dividend growth rate, PPG Industries has a long dividend payback period of 34 years (using 3.9% dividend growth rate).
Valuation and Final Thoughts
Over the last decade, PPG Industries’ average price-to-earnings ratio is just 12.6. The business has undergone significant changes since that time – switching from lower margin businesses to the higher margin coatings industry.
To get a better idea of fair value for the company, consider rival Sherwin-Williams’ historical average price-to-earnings ratio of 17.5. This is a better fair earnings multiple for PPG Industries than its own historical average.
PPG Industries is trading for a price-to-earnings ratio of 16.8 (using adjusted earnings). The company is likely currently fairly valued (or very slightly undervalued).
Investors who cannot wait to get exposure to the paint industry should consider PPG Industries at current prices.
The company’s low dividend yield and low dividend growth make this company an unappealing investment for income seeking dividend growth investors.
Patient investors looking for exposure to the coatings industry should purchase this Dividend Aristocrat and PPG rival when it reaches fair or undervalued territory.
