Diversification is a familiar term to most investors because it refers to the age-old concept of “don’t put all your eggs in one basket.” But the benefits of diversification can only be understood through a deeper understanding of the concept of correlation.
Correlation defined
Imagine a flock of birds in the sky, or a school of fish swimming together in the ocean. While each group contains individuals that can make their own decisions, as a group, they tend to move in the same direction almost simultaneously. It is visually striking to watch them move together in near perfect unison as if they were connected by invisible strings. In fact, we can describe the relationship between the birds or the fish as having a nearly perfect correlation. The degree to which the individuals in the group are connected is a function of their correlation.
It is easy to visualize portfolios of individual stocks as being just another example of group behaviour. At times, the individual stocks move together in perfect unison like a flock of birds, and at other times they seem to go in their own direction. Correlation is quantified via a statistic called the Correlation Coefficient, which varies between -1 (moves in opposite directions) and +1 (moves in the same direction). A coefficient of 0 indicates no relationship.
A common misconception is that two securities with a perfect negative correlation will cancel each other out, leaving a portfolio return of zero, but this is not the case. Correlation describes the degree to which two securities deviate in the same direction from their individual average returns. In this way, two securities can be perfectly negatively correlated (coefficient of -1) but also move in the same general direction over time.
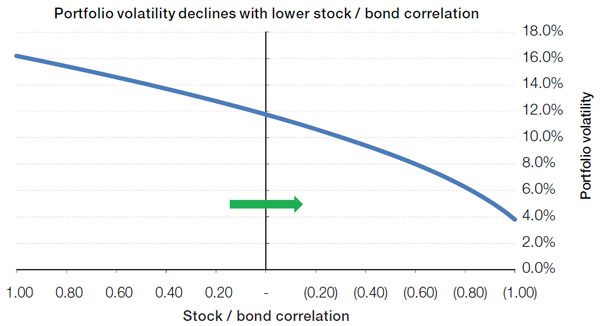
Stocks and bonds provide an intuitive example of this phenomenon. Both stocks and government bonds exhibit positive average long-term average returns, but they are negatively correlated over the long-term. In this way, while the average volatility of stocks is 20 percent and the average volatility of bonds is 12 percent, the long-term realized volatility of a 50/50 stock and government bond portfolio is 10.6 percent rather than16 percent, which is the arithmetic average of the two securities (see chart).
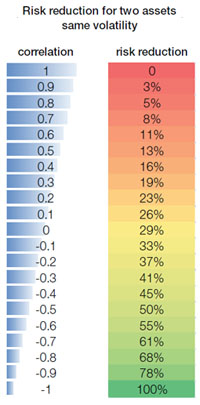
In fact, the mathematical relationship between volatility and correlation was the breakthrough that landed Harry Markowitz his Noble Prize in Economics. From this equation it can be demonstrated that portfolio volatility always declines as correlation trends from +1 to -1, and volatility is eliminated entirely when correlation reaches -1 (see table). 
In our article on volatility, we demonstrated how managing exposures to individual securities to control volatility resulted in higher absolute and risk-adjusted returns for a variety of asset classes. You can see how correlation and diversification can be applied at the portfolio level by measuring and allocating to assets within portfolios purely on the basis of correlation.
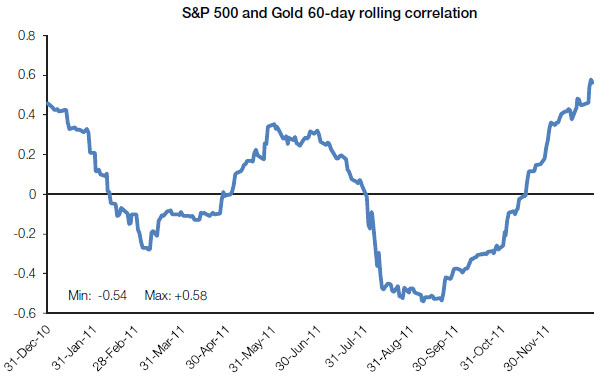
Unfortunately, in practice, most Portfolio Managers make long-term assumptions about correlations between assets. But actual correlations between assets can vary widely over time. Thus, it makes sense to constantly observe the actual correlation over time and adjust the portfolio accordingly. In the chart below, we see the actual historical 60-day rolling correlation between the S&P 500 index and Gold through 2011. Notice that the correlation statistic trends up and down over time, and is persistent over short time periods like days and weeks.
The observed correlation over the recent past can be measured and used to inform the relative allocations to securities in order to target a certain portfolio risk. By widening the scope to other major asset classes and tracking them, we have found that we can observe changes in the correlations to create lower-risk portfolios than are traditionally available to investors without sacrificing returns.
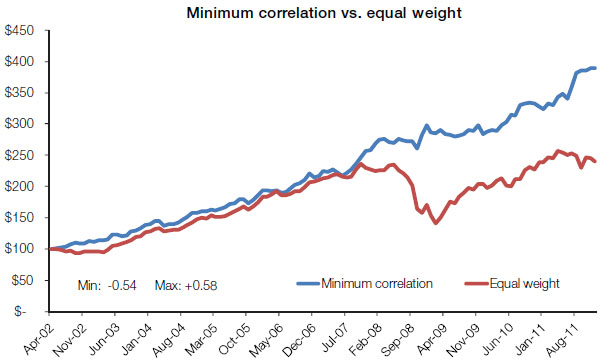
To illustrate, the chart below displays two fictitious portfolios whose investment universe is composed of the 10 major global asset classes ( Commodities, Emerging Markets, Japan, Gold, US Real estate, Europe, International Real Estate, 20-Year Treasuries, Global Equities. ). The red line represents an equal weight portfolio of the asset classes rebalanced monthly. The blue line represents a monthly rebalanced portfolio using a Minimum Correlation algorithm. The method is similar to the Minimum Variance algorithm that has become well-accepted by sophisticated practitioners and academics. While Minimum Variance focuses on minimizing total portfolio risk, the Minimum Correlation algorithm focuses on maximizing diversification by holding non-correlated assets with an optimal weighting scheme.
The returns of the minimum correlation portfolio are 14.54 percent compared to 8.45 percent of the equal weight portfolio. More importantly, the annualized volatility comparison is 8.45 percent versus 12.94 percent respectively. Both the absolute and risk-adjusted returns were substantially improved by harnessing the power of correlation.
All chart sources: Yahoo Finance.
- English (UK)
- English (India)
- English (Canada)
- English (Australia)
- English (South Africa)
- English (Philippines)
- English (Nigeria)
- Deutsch
- Español (España)
- Español (México)
- Français
- Italiano
- Nederlands
- Português (Portugal)
- Polski
- Português (Brasil)
- Русский
- Türkçe
- العربية
- Ελληνικά
- Svenska
- Suomi
- עברית
- 日本語
- 한국어
- 简体中文
- 繁體中文
- Bahasa Indonesia
- Bahasa Melayu
- ไทย
- Tiếng Việt
- हिंदी
Diversification: Still The Only Free Lunch
Published 05/09/2012, 12:44 AM
Updated 07/09/2023, 06:31 AM
Diversification: Still The Only Free Lunch
Latest comments
Loading next article…
Install Our App
Risk Disclosure: Trading in financial instruments and/or cryptocurrencies involves high risks including the risk of losing some, or all, of your investment amount, and may not be suitable for all investors. Prices of cryptocurrencies are extremely volatile and may be affected by external factors such as financial, regulatory or political events. Trading on margin increases the financial risks.
Before deciding to trade in financial instrument or cryptocurrencies you should be fully informed of the risks and costs associated with trading the financial markets, carefully consider your investment objectives, level of experience, and risk appetite, and seek professional advice where needed.
Fusion Media would like to remind you that the data contained in this website is not necessarily real-time nor accurate. The data and prices on the website are not necessarily provided by any market or exchange, but may be provided by market makers, and so prices may not be accurate and may differ from the actual price at any given market, meaning prices are indicative and not appropriate for trading purposes. Fusion Media and any provider of the data contained in this website will not accept liability for any loss or damage as a result of your trading, or your reliance on the information contained within this website.
It is prohibited to use, store, reproduce, display, modify, transmit or distribute the data contained in this website without the explicit prior written permission of Fusion Media and/or the data provider. All intellectual property rights are reserved by the providers and/or the exchange providing the data contained in this website.
Fusion Media may be compensated by the advertisers that appear on the website, based on your interaction with the advertisements or advertisers.
© 2007-2025 - Fusion Media Limited. All Rights Reserved.
