
The head and shoulders chart pattern has become a stalwart in the arsenal of many traders over the last few decades. The reason is not difficult to find: it has proven itself to be a remarkably reliable indicator of future price movements.
As the name implies, the pattern looks very similar to a head with two shoulders on the side.
The following graph shows a typical head and shoulders pattern.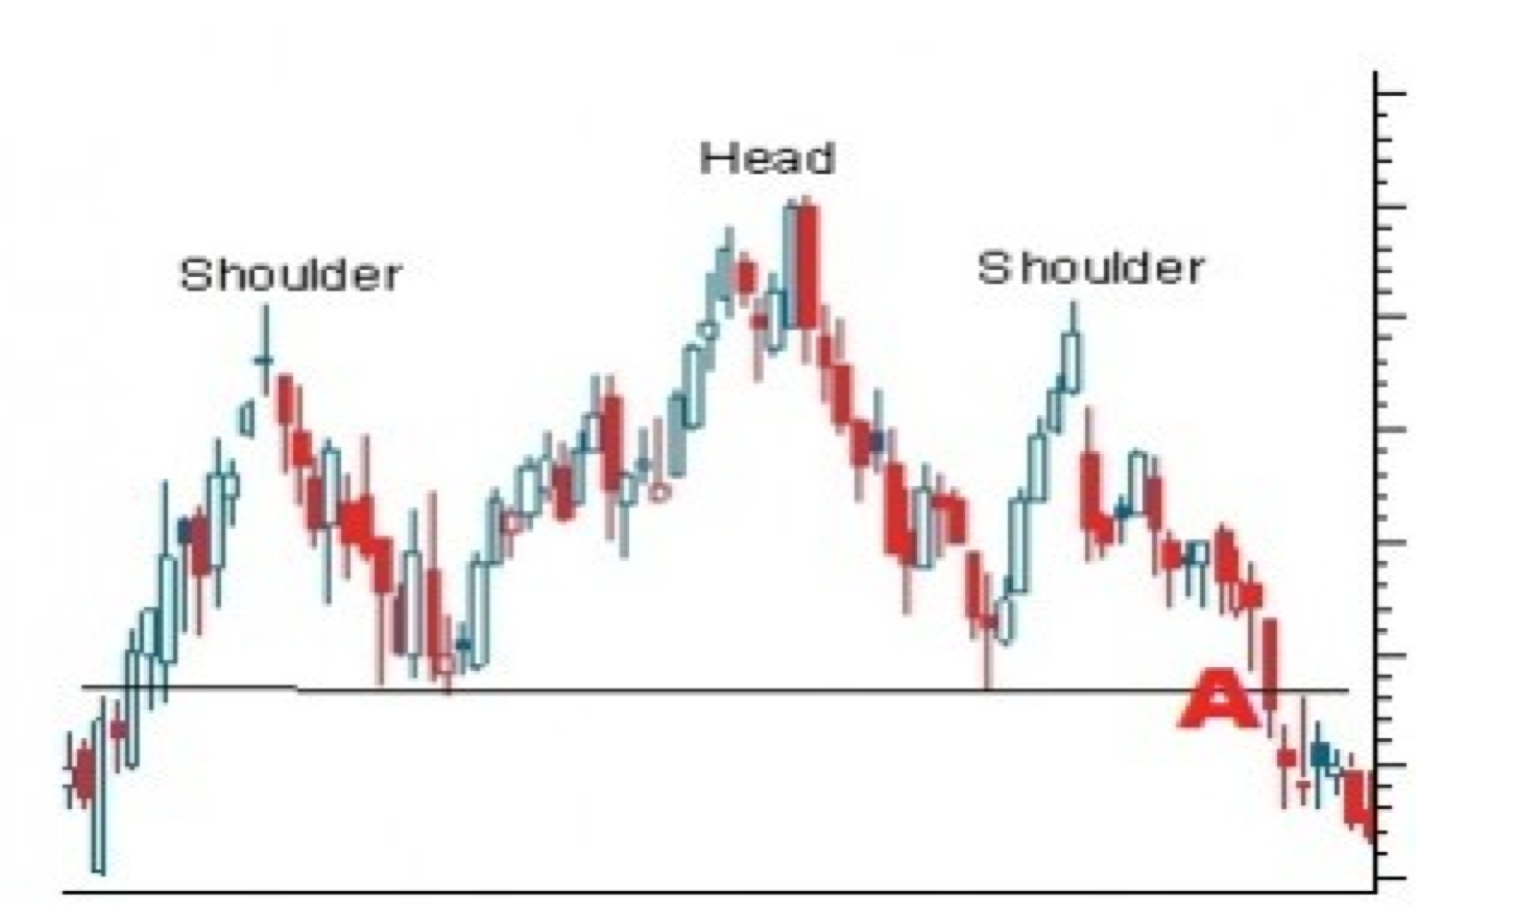
Reversal Pattern
The head and shoulders pattern is what is referred to in the industry as a reversal pattern. This simply means that when a CFD trader encounters this pattern on a stock, FX or commodity chart, chances are very good that the underlying security is about to undergo a change in trend.
The pattern has two different versions, one that appears in uptrends and one that appears in downtrends. The traditional pattern pictured above appears when the uptrend is about to be reversed and a downtrend becomes a very high likelihood.
Before The Uptrend
The second version, sometimes described as the inverse head and shoulders, usually appears in a downtrend and this signals that the trend is about to reverse and that a new uptrend has become a high probability.
The graph below shows a typical inverse head and shoulders pattern. Note how the volume increases once the new trend gets properly underway.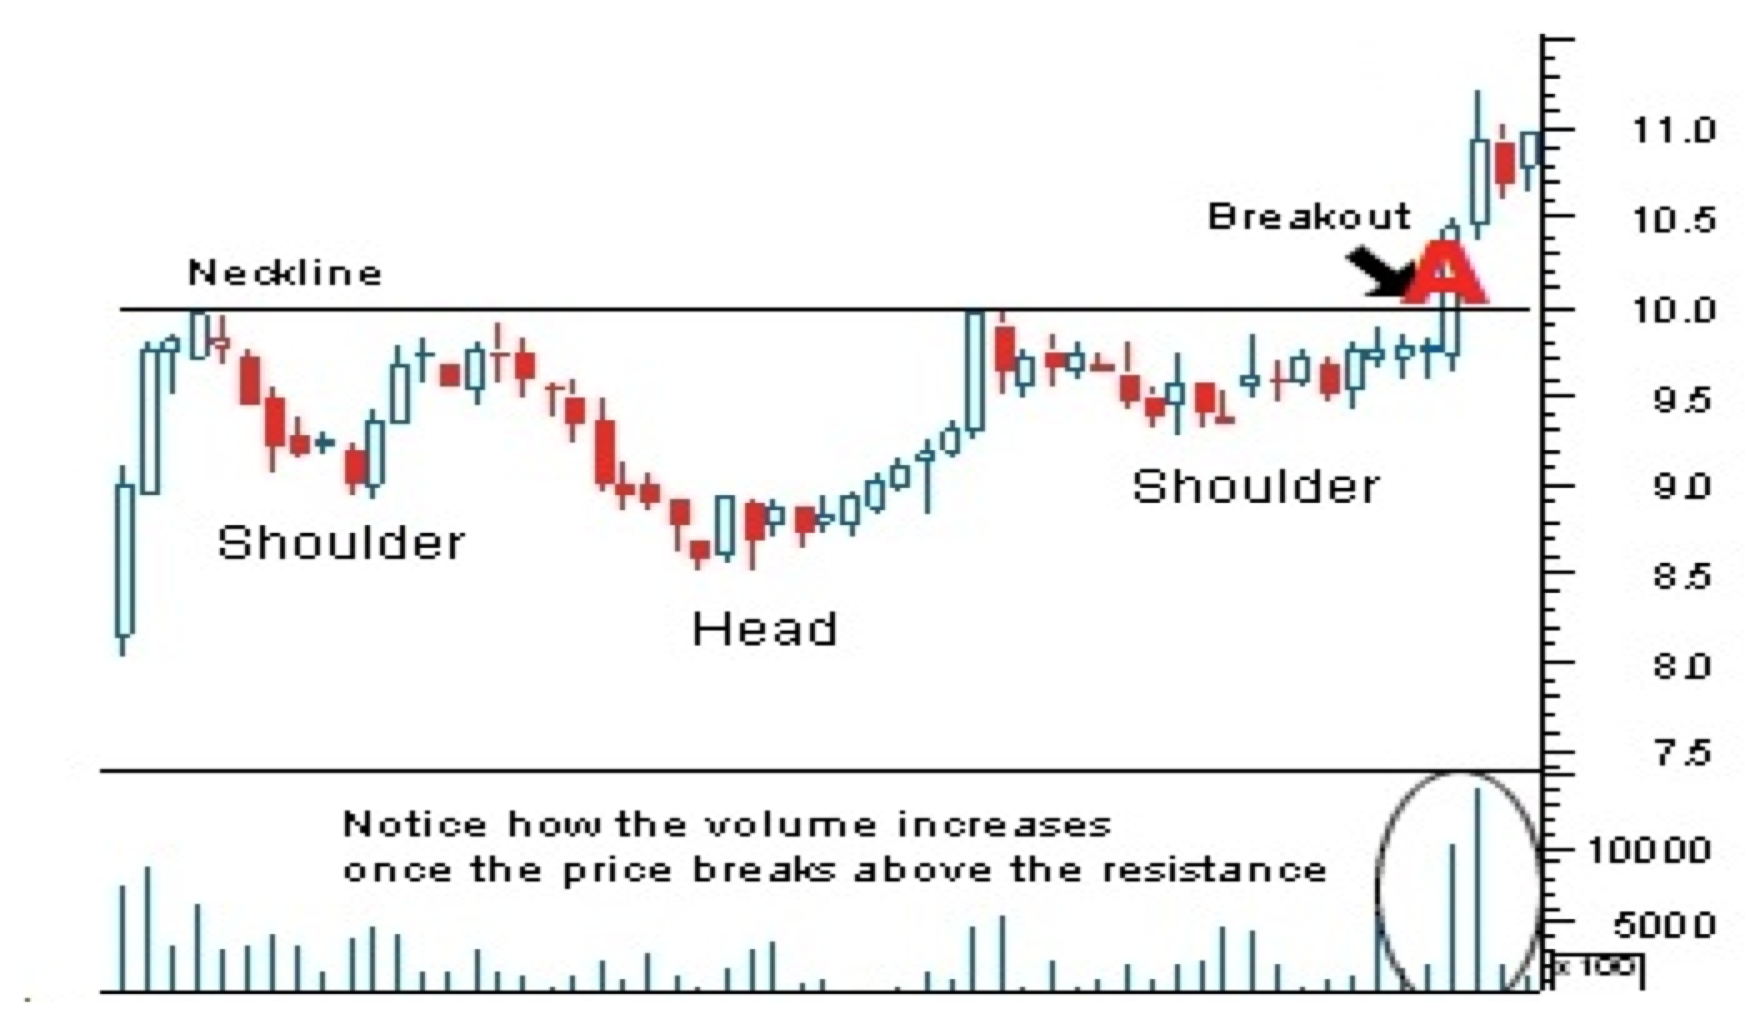
Similarities: Peaks And Troughs
The construction of both types of head and shoulders patterns is quite similar. Studying the chart will show a head section in the middle, two shoulders on the sides and two necklines between the shoulders and the head.
What the trader should wait for, here, is the second shoulder to form and the price to break up or down above or below the second shoulder. This happened at point A in both the above charts.
The head and shoulders together form a set of peaks and troughs. On the other hand, the neckline provides a level of support (during and uptrend) or resistance (during a downtrend).
Down's Theory
Essentially the pattern is based on an analysis of peak-and-trough analysis in terms of Down’s Theory. An uptrend can be interpreted as a series of successive rising tops and rising bottoms. Whereas, a downtrend consists of a series of lower highs and lower lows.
When the trend starts to weaken, these ‘peaks and troughs’ fail to make new highs (during an uptrend) or new lows (during a downtrend) -- hence the trademark troughs of the head and shoulders pattern. Note that the two troughs do not always fall on a horizontal line, the second one might be slightly higher or lower than the first one.
Sometimes, immediately after breaking through the ‘neckline’, the price of a security will revert back to the neckline.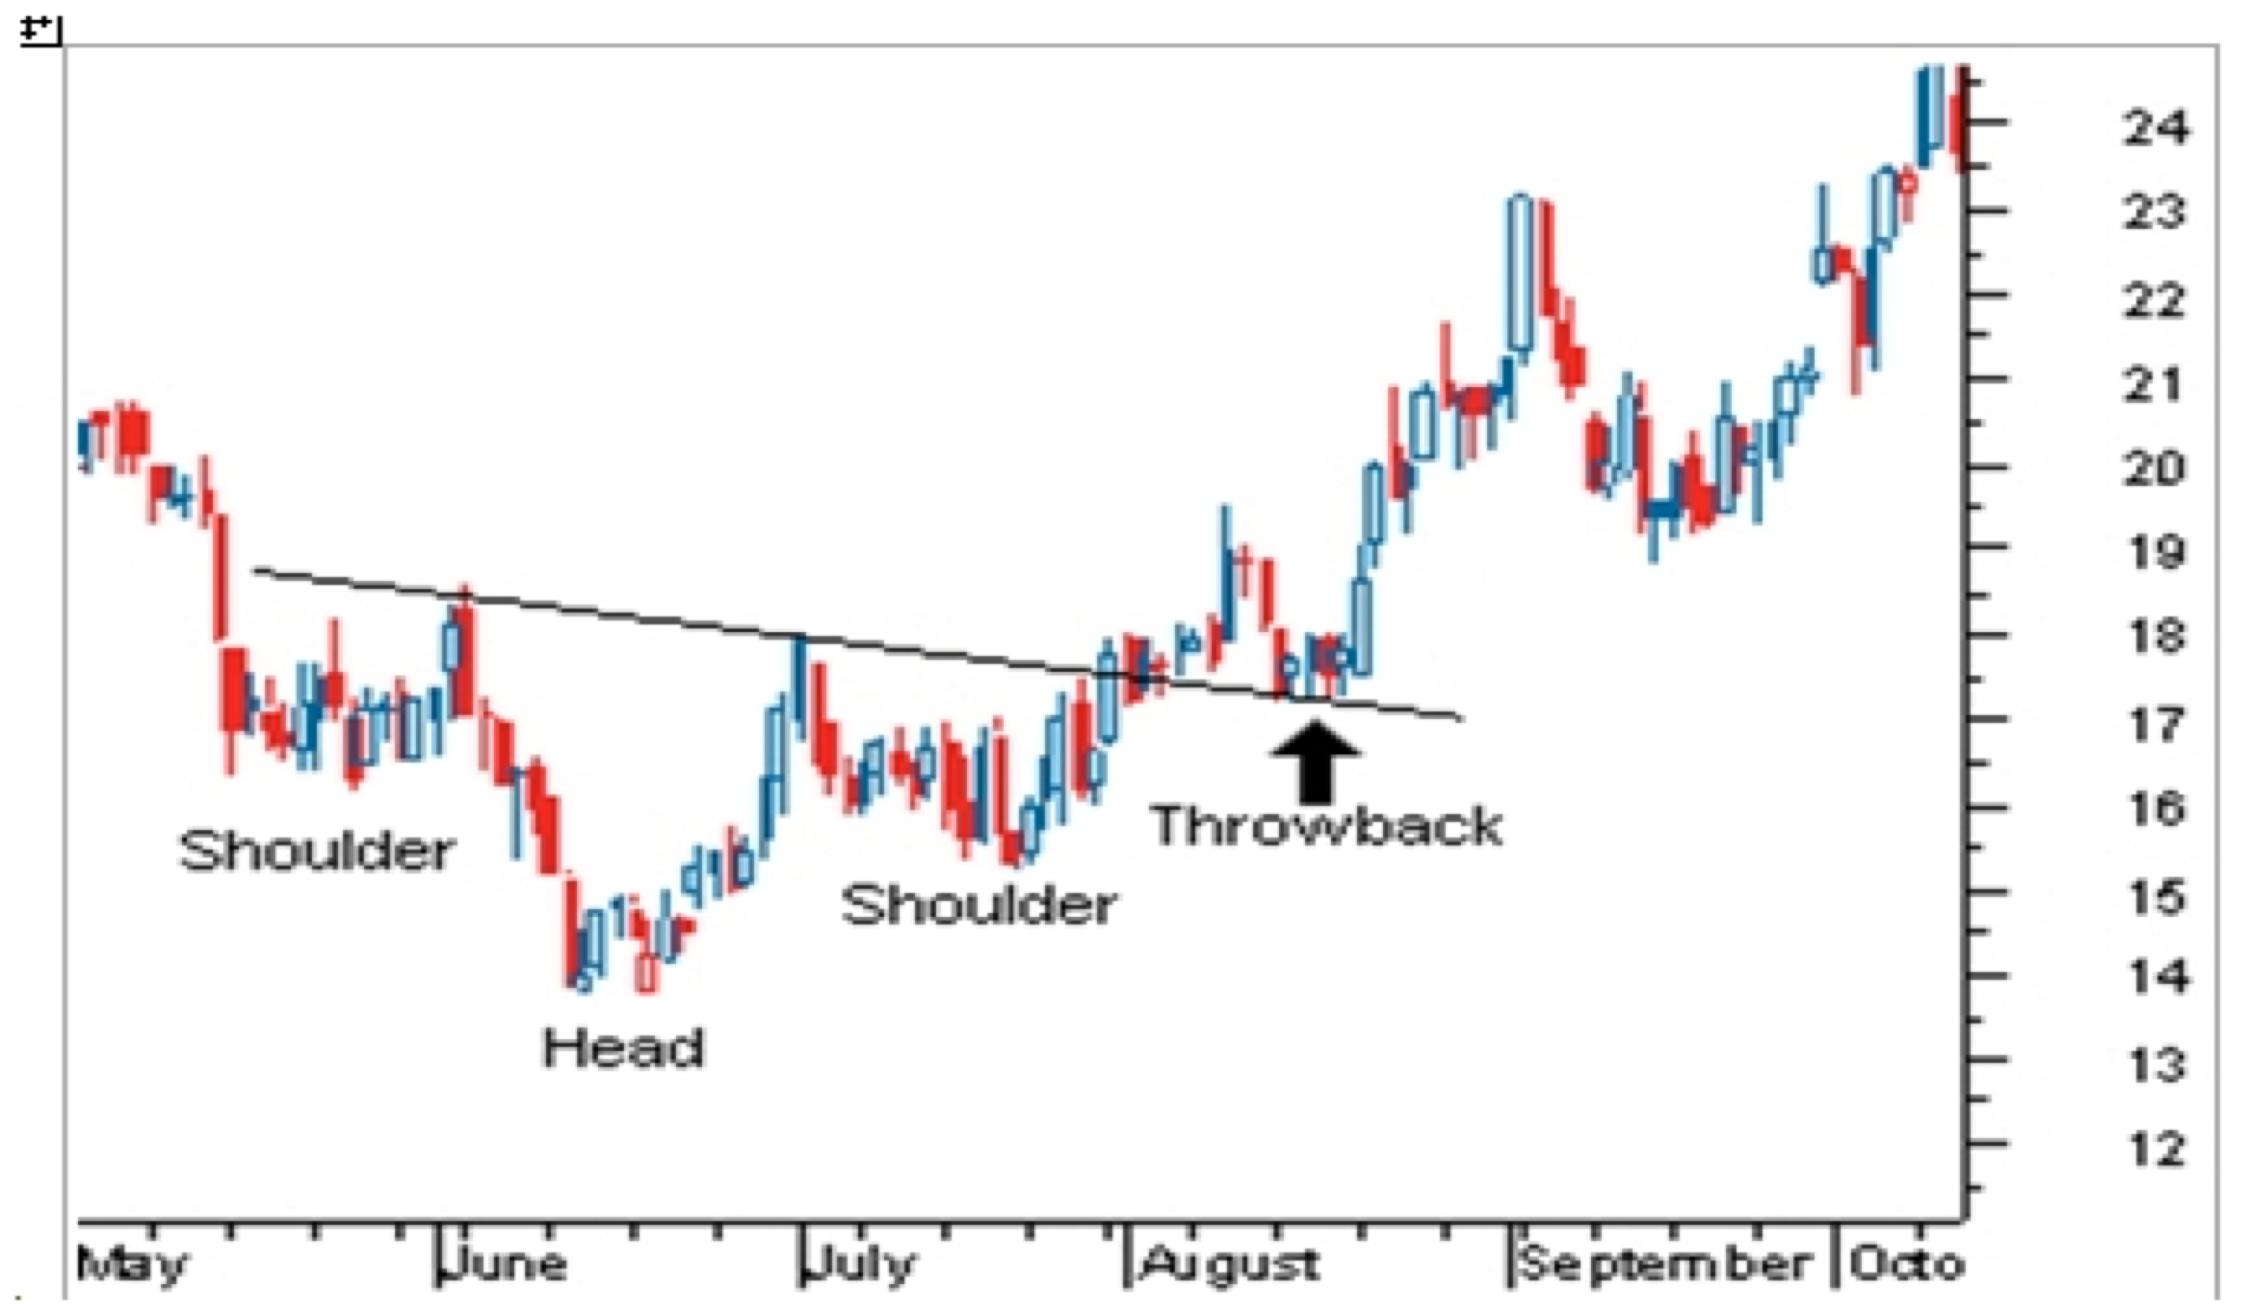
The 'Throwback'
At the point marked ‘throwback’ in the above chart, the price had broken through the shoulder and then dropped back to the same level. This is no cause for alarm. All it signifies is that what previously used to be a resistance level has now changed to a support level. It actually underscores the strength of the signal.
If the price, however, drops significantly below the shoulder in what is supposed to be the start of a new uptrend, it could mean the trend has been broken and that the previous downtrend would continue.
- English (UK)
- English (India)
- English (Canada)
- English (Australia)
- English (South Africa)
- English (Philippines)
- English (Nigeria)
- Deutsch
- Español (España)
- Español (México)
- Français
- Italiano
- Nederlands
- Português (Portugal)
- Polski
- Português (Brasil)
- Русский
- Türkçe
- العربية
- Ελληνικά
- Svenska
- Suomi
- עברית
- 日本語
- 한국어
- 简体中文
- 繁體中文
- Bahasa Indonesia
- Bahasa Melayu
- ไทย
- Tiếng Việt
- हिंदी
Dissecting The Head And Shoulders
Latest comments
Loading next article…
Install Our App
Risk Disclosure: Trading in financial instruments and/or cryptocurrencies involves high risks including the risk of losing some, or all, of your investment amount, and may not be suitable for all investors. Prices of cryptocurrencies are extremely volatile and may be affected by external factors such as financial, regulatory or political events. Trading on margin increases the financial risks.
Before deciding to trade in financial instrument or cryptocurrencies you should be fully informed of the risks and costs associated with trading the financial markets, carefully consider your investment objectives, level of experience, and risk appetite, and seek professional advice where needed.
Fusion Media would like to remind you that the data contained in this website is not necessarily real-time nor accurate. The data and prices on the website are not necessarily provided by any market or exchange, but may be provided by market makers, and so prices may not be accurate and may differ from the actual price at any given market, meaning prices are indicative and not appropriate for trading purposes. Fusion Media and any provider of the data contained in this website will not accept liability for any loss or damage as a result of your trading, or your reliance on the information contained within this website.
It is prohibited to use, store, reproduce, display, modify, transmit or distribute the data contained in this website without the explicit prior written permission of Fusion Media and/or the data provider. All intellectual property rights are reserved by the providers and/or the exchange providing the data contained in this website.
Fusion Media may be compensated by the advertisers that appear on the website, based on your interaction with the advertisements or advertisers.
© 2007-2025 - Fusion Media Limited. All Rights Reserved.