Who is Kevin Hassett? Wolfe looks at the Trump ally tipped to become Fed Chair.
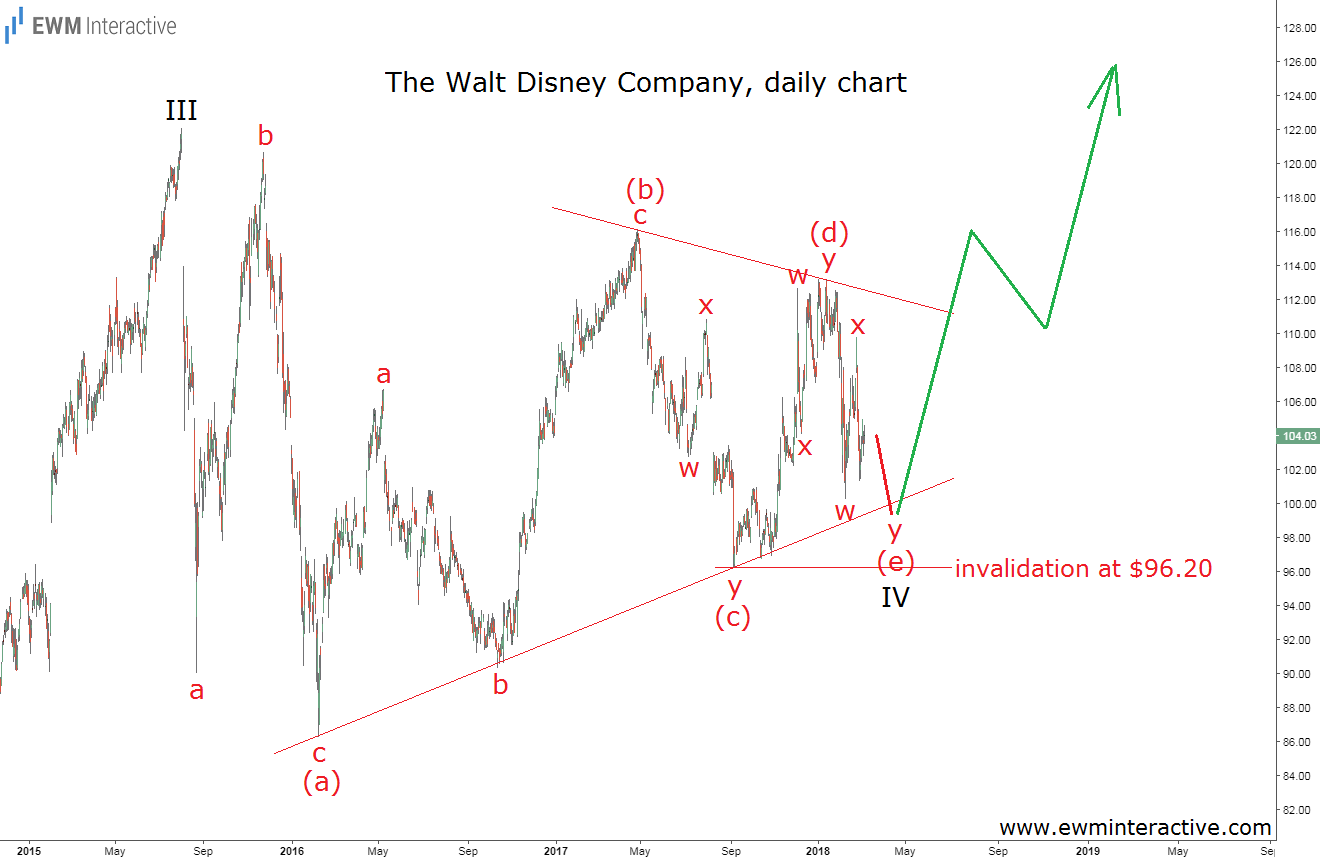
The last time we wrote about Disney (NYSE:DIS) stock was on April 17th. The company had just announced its own streaming service, sending the price sharply higher to over $130 a share. The interesting part was not the surge itself, but the fact that the Elliott Wave principle managed to prepare us for it a year in advance. The chart below, published in March 2018, explains how.

Back in March 2018, Disney’s daily chart revealed that a triangle correction has been forming since mid-2015. Triangles are continuation patterns, which means that once a triangle is over the larger trend resumes. Disney stock was clearly in an uptrend prior to this pattern, so it made sense to expect a new record high as the bulls returned.
Disney Stock Gained 50%. It Can Now Lose 40%.
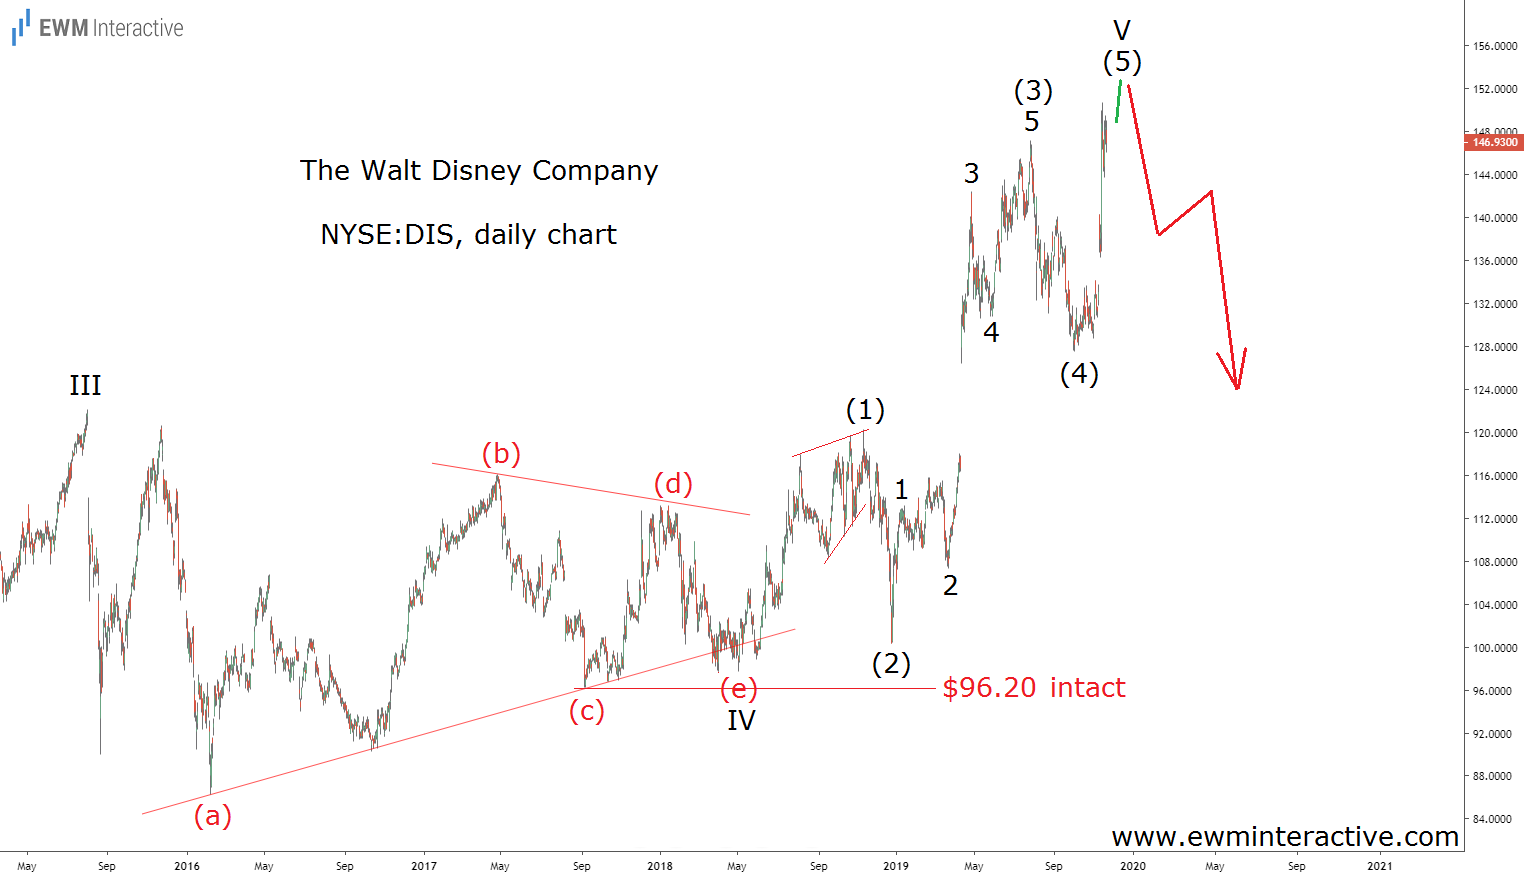
The pattern was labeled (a)-(b)-(c)-(d)-(e) and also allowed us to identify a specific invalidation level. Wave (e) was not supposed to breach the bottom of wave (c) at $96.20. Twenty months later now, the updated chart below shows that it didn’t.

$96.20 survived, which later allowed Disney stock to climb to a new all-time high of $150.63 as of last week. Unfortunately for the bulls, the other thing about triangles is that they precede the final wave of the larger sequence. Here, the triangle is marked as wave IV, meaning the following surge must be the fifth and final wave of the post-2009 uptrend.
Wave V has a clear impulsive structure. It is labeled (1)-(2)-(3)-(4)-(5), where the five sub-waves of wave (3) are also visible. If this count is correct, wave V is almost over and a bearish reversal can soon be expected. The anticipated decline has the potential to erase all of wave V’s gains and drag Disney stock back to the $100 – $90 support area.
Disney has both the money and the content to make Disney+ a huge success. However, the charts are giving a good reason to prepare for a 30% to 40% decline in the stock price regardless of it.
