
“Should you find yourself in a chronically leaking boat, energy devoted to changing vessels is likely to be more productive than energy devoted to patching leaks.”- Warren Buffett.
At the moment, the quote fits perfectly for Urban Outfitters, Inc. (NASDAQ:URBN) as the company’s near-term future looks bleak. Investors need to exercise extreme caution when it comes to the stock as it is unlikely to show any major improvement in the near future. Urban Outfitters has exhibited a bearish run in the past six months plunging roughly 32.8% compared with the Zacks categorized Retail-Apparel/Shoe industry’s declined of 16.3%. Let’s delve deeper and try to find out what’s taking this Zacks Rank #5 (Strong Sell) company downhill.
Urban Outfitters Scorecard
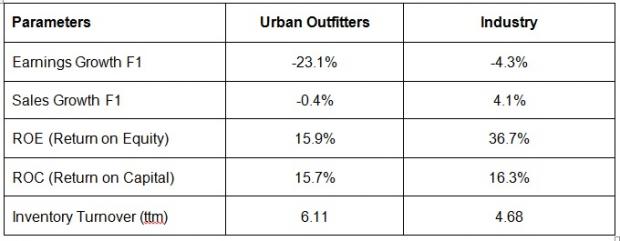
On the Front of Top & Bottom Lines
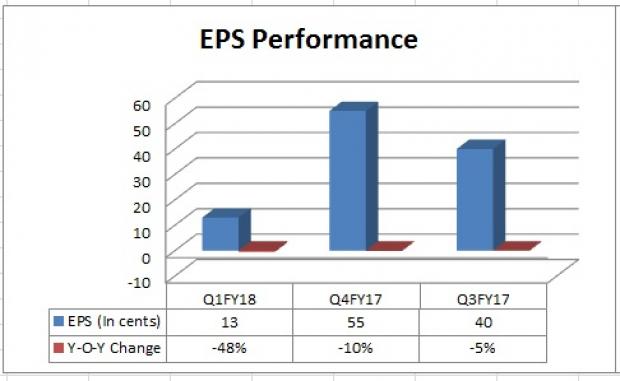
Urban Outfitters’ both top-line and bottom-line has missed the Zacks Consensus Estimate in the trailing three quarters. In the first-quarter fiscal 2018, this lifestyle specialty retail company reported earnings per share of 13 cents that lagged the Zacks Consensus Estimate of 16 cents. Further, the bottom line also declined 48% year over year. Moreover, in the fourth and third quarter of fiscal 2017 earnings have declined 10% and 5% year-over-year, respectively.
Let’s look at Urban Outfitters earnings estimate revisions in order to get a clear picture of what analysts are thinking about the stock. In the past 60 days, the Zacks Consensus Estimate for the second quarter and fiscal 2018 declined 20 cents and 31 cents to 39 cents and $1.43, respectively.
On the Front of Comparable sales
Investors’ sentiment further took a hit after the company stated in a SEC filing (as of Jun 8, 2017) that “thus far during the second quarter of fiscal 2018, comparable retail segment net sales are high single-digit negative.” In the first quarter fiscal 2018, comparable retail segment net sales, including the comparable direct-to-consumer channel, were down 3.1% year over year. Comparable retail segment net sales fell 3.1% at Urban Outfitters and 4.4% at Anthropologie Group but increased 1.5 % at the Free People.
Soft comparable sales performance at Anthropologie Group has been a major concern for the company. In the fourth, third and second quarters of fiscal 2017, comps at Anthropologie Group declined 2.2%, 2.7% and 3%, respectively.
On the Front of Gross Margin
Investors are also concerned by management’s remark over gross margin, which is anticipated to decline year over year in the second quarter fiscal of 2018 on account of rise in delivery and logistic expenses, higher markdowns and lower initial mark up.
In the first quarter of fiscal 2018, the company’s gross margin contracted 284 basis points (bps) to approximately 31.5% primarily due to deleverage in customer delivery and logistics expense rates along with higher markdowns. This can be attributed to dismal performance of women’s apparel and accessories product at Anthropologie and Urban Outfitters. We noted that, gross margin had contracted 142 bps and 15 bps in the fourth and third quarter of fiscal 2017 to 33% and 34.8%, respectively.
Key Picks in Retail Space
Better-ranked stocks which warrant a look in the retail space include G-III Apparel Group, Ltd. (NASDAQ:GIII) , Guess', Inc. (NYSE:GES) and The Children's Place, Inc. (NASDAQ:PLCE) . All the three stocks sport a Zacks Rank #1 (Strong Buy).You can see the complete list of today’s Zacks #1 Rank stocks here.
G-III Apparel Group has an impressive long-term earnings growth rate of 15%.
Guess' has an impressive long-term earnings growth rate of 17.5% and also surpassed the Zacks Consensus Estimate in the trailing four quarters, with an average earnings beat of 33%.
The Children's Place has reported earnings beat in the trailing four quarters, with an average of 36.6%.
Today's Stocks from Zacks' Hottest Strategies
It's hard to believe, even for us at Zacks. But while the market gained +18.8% from 2016 - Q1 2017, our top stock-picking screens have returned +157.0%, +128.0%, +97.8%, +94.7%, and +90.2% respectively.
And this outperformance has not just been a recent phenomenon. Over the years it has been remarkably consistent. From 2000 - Q1 2017, the composite yearly average gain for these strategies has beaten the market more than 11X over. Maybe even more remarkable is the fact that we're willing to share their latest stocks with you without cost or obligation. See Them Free>>
Urban Outfitters, Inc. (URBN): Free Stock Analysis Report
Children's Place, Inc. (The) (PLCE): Free Stock Analysis Report
Guess?, Inc. (GES): Free Stock Analysis Report
G-III Apparel Group, LTD. (GIII): Free Stock Analysis Report
Original post
Zacks Investment Research