I suspect that only a few of you will remember back to the days when Sears Holdings Corporation (NASDAQ:SHLD) was where you went on the weekend to get everything. And I mean everything. They did oil changes and new tires for your car. They had all the tools you could want. The store was packed with clothes and toys and home goods. Everyone went there. They also had an innovative idea to start their own credit card in the mid 1980’s.
Fast forward 30 years and hedge fund titan Eddie Lampert is trying to prop up Sears as a real estate investment, because that is all that is left that has any value. And that credit card company, Discover Financial Services (NYSE:DFS) is a $21 billion company, 12 times bigger than Sears. And they are reporting their latest earnings tonight.
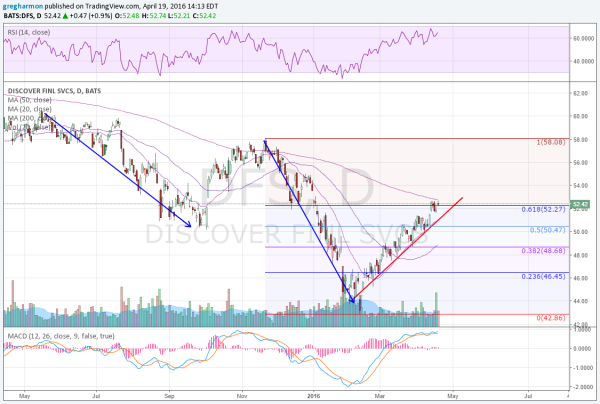
The stock saw a move lower last summer but then a bounce to near 58 in November. From there it fell back to 43 in mid February. The price action since then has been nothing but stellar. Retracing 61.8% of the move lower, it is up 22% since that February low. And the chart looks healthy.
The last month the price crossed the 20 day SMA and has been riding it higher. The RSI is bullish an rising with a MACD that is positive, if starting to level. But both support more upside. The 200 day SMA overhead gives a slight pause, but for an event driven thing like an earnings report there can be a gap right through it. And speaking of gaps, the stock has moved and average of 4.28% the last 6 times it reported earnings. That is a move of $2.25 at current prices and gives an expected range of 50.15 to 54.70.
The April 22 Expiry options chain suggest a smaller $1.80 move this week by Friday, with implied volatility (IV) at 45%, above the longer run IV at 22% in May. Most of the open interest in the weekly options is below the current price with the biggest at the 50.5 Strike.
Discover Financial Services, DFS
Trade Idea 1: Buy the April 22 Expiry 52 Puts for 75 cents.
Trade Idea 2: Buy the April 22 Expiry 52/51 Put Spreads for 45 cents.
Trade Idea 3: Buy the April 22 Expiry 52/50.5/49 Put Butterfly for 40 cents.
Trade Idea 4: Buy the April 22 Expiry/May 54 Call Calendar for 45 cents.
Trade Idea 5: Buy the April 22 Expiry/May 54 Call Calendar and sell the May 6 Expiry 50 Puts for free.
Only the last idea uses margin, the rest just the capital to enter the trade. #1 gives the downside under 52. #2 caps that at 51 but for less cash outlay, preserving a better than 2;1 reward to risk ratio. #3 looks for a pin at that 50.5 strike with the large open interest where it will pay $1.50. #4 looks for longer term upside to continue, but not above 54 this week. And #5 adds leverage and a possible entry to the stock at 50 at may 6 Expiry. Which credit card trade is for you?
DISCLAIMER: The information in this blog post represents my own opinions and does not contain a recommendation for any particular security or investment. I or my affiliates may hold positions or other interests in securities mentioned in the Blog, please see my Disclaimer page for my full disclaimer.
