This is the first of three year-end articles. This piece will focus on the last 12 months of economic growth along with the upcoming projections of the LEIs and CEIs offered by the Conference Board. The conclusion is that the next 6-12 months are looking fairly positive. In the next post, I’ll analyze potential problems that might negatively impact the US economy while in the third, I’ll look at potential international problem areas.
GDP grew weakly at the beginning of the year, only rising .8% in the 1st quarter and 1.4% in the second. But it picked-up considerable steam in the 3rd quarter, growing a strong 3.2%. An analysis of the contributions to growth for the last 5 quarters explains the causes:
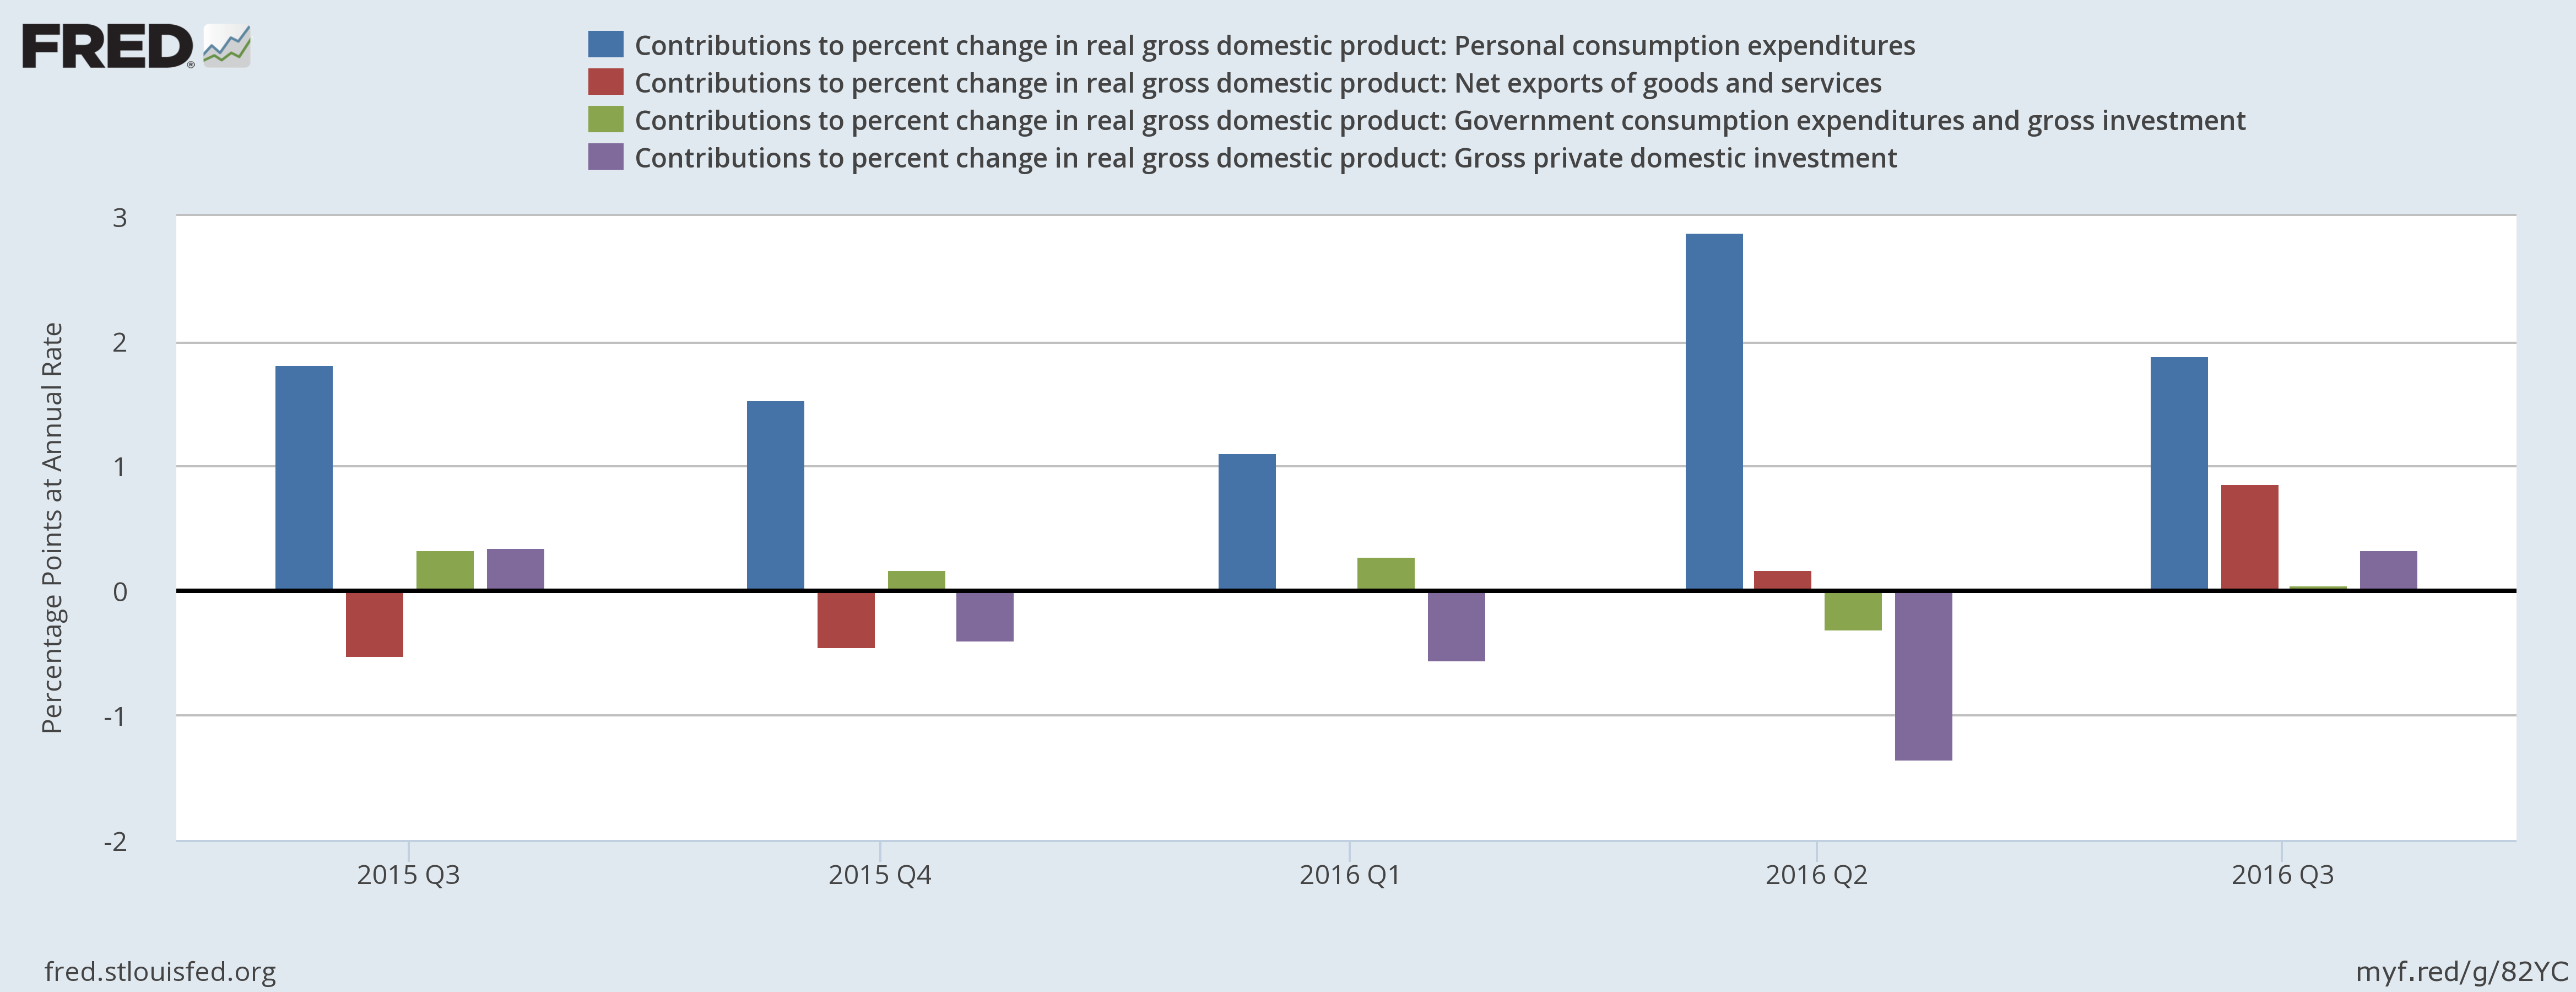
Personal consumption expenditures (in blue) consistently grew over the last 5 quarters. Exports (red) and government spending (green) have had a minor impact (save for export’s strong contribution last quarter). Weak investment has been the primary drag on growth:
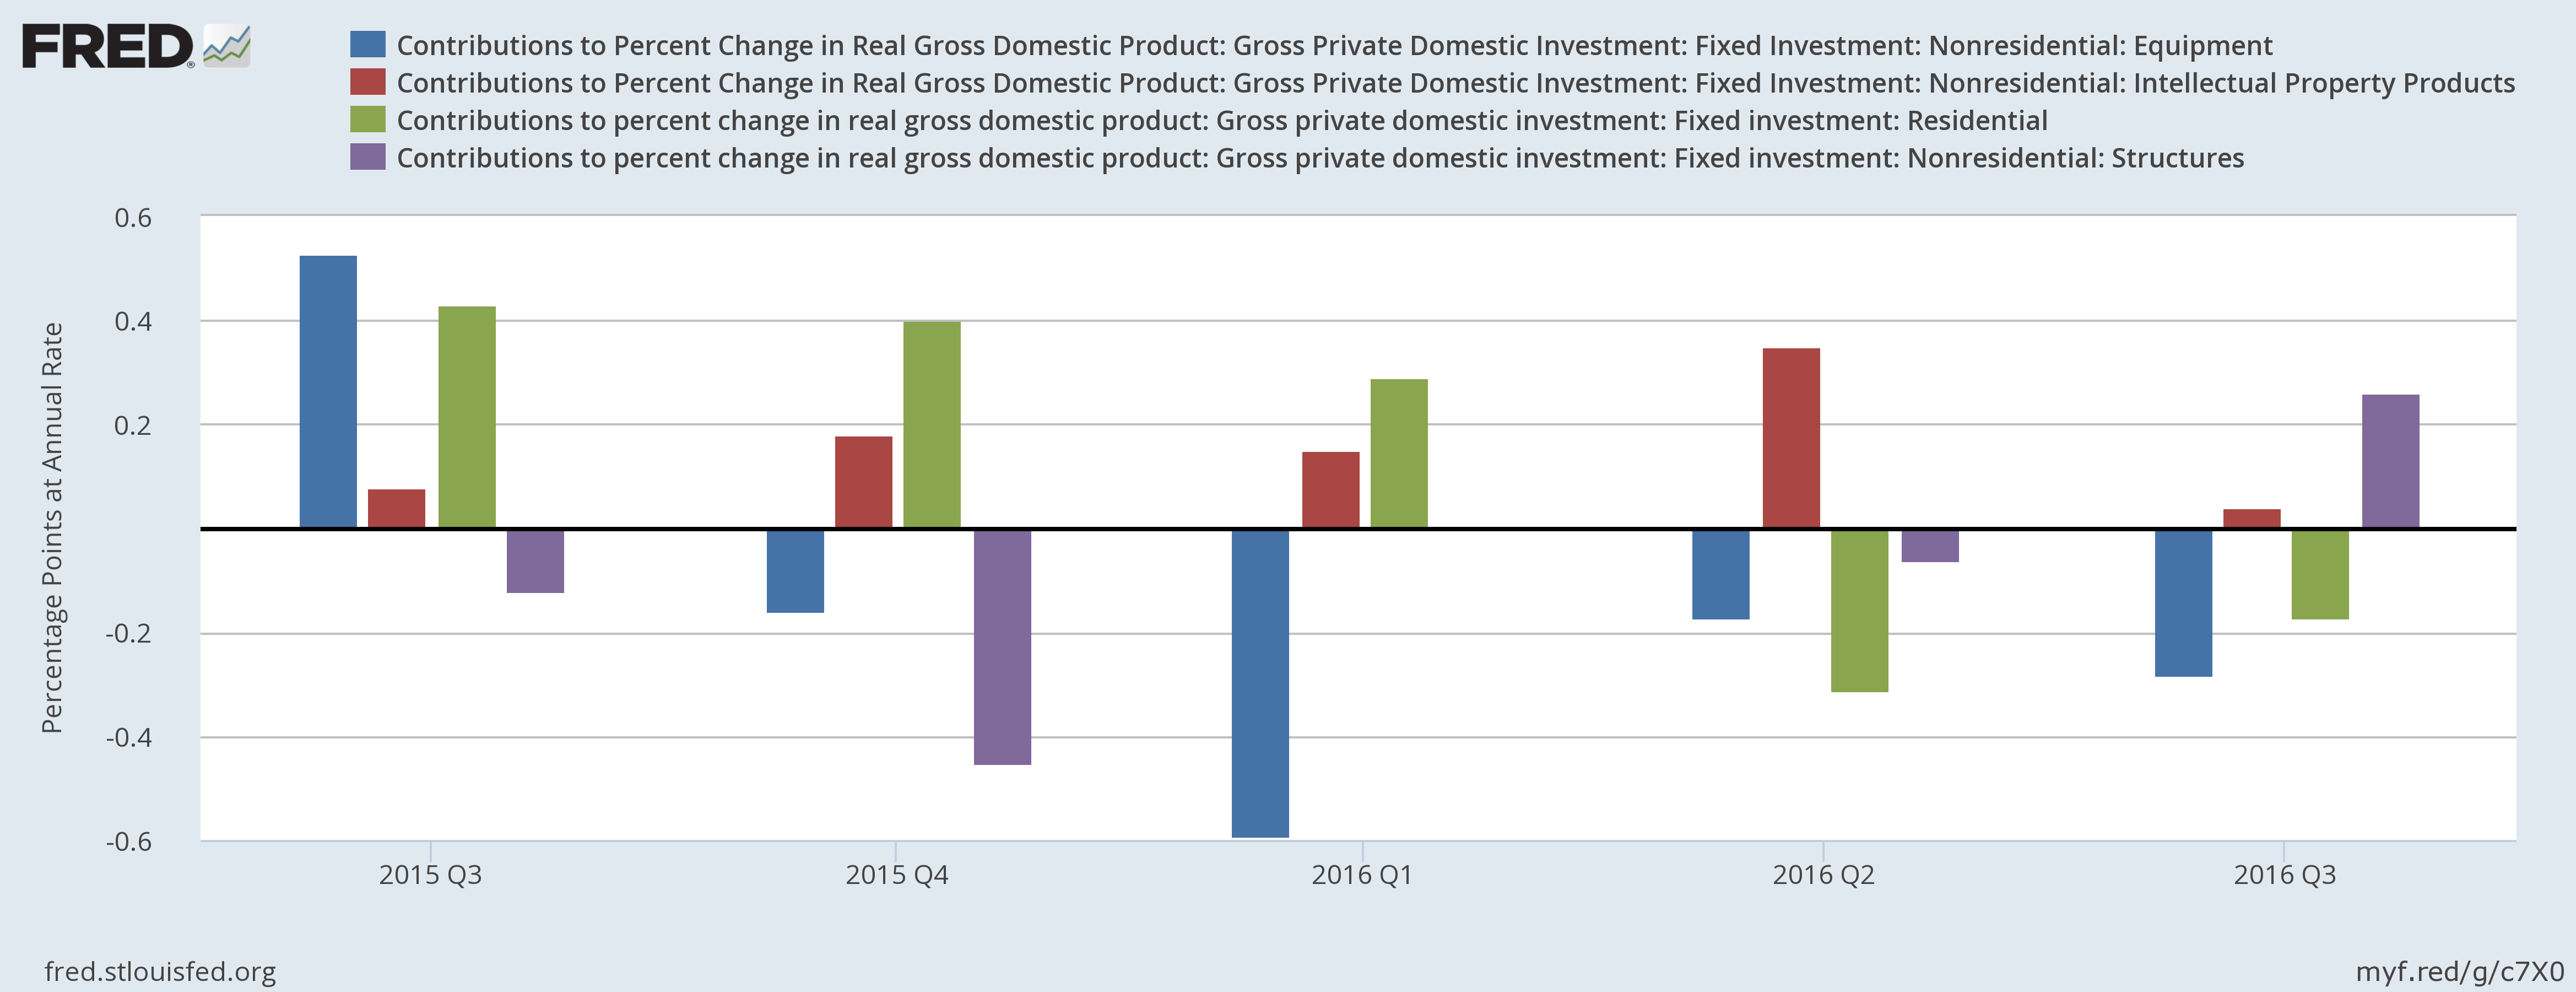
The oil market slowdown caused the equipment investment contraction over the last 4 quarters. December’s agreement between Saudi Arabia and Russia to cut oil production has already lifted oil prices and should lead to increased oil drilling activity. Residential investment contracted the last 2 quarters. But the recent interest rate increases may slow the housing market, leading to further residential investment contraction.
In general, the employment picture has improved:
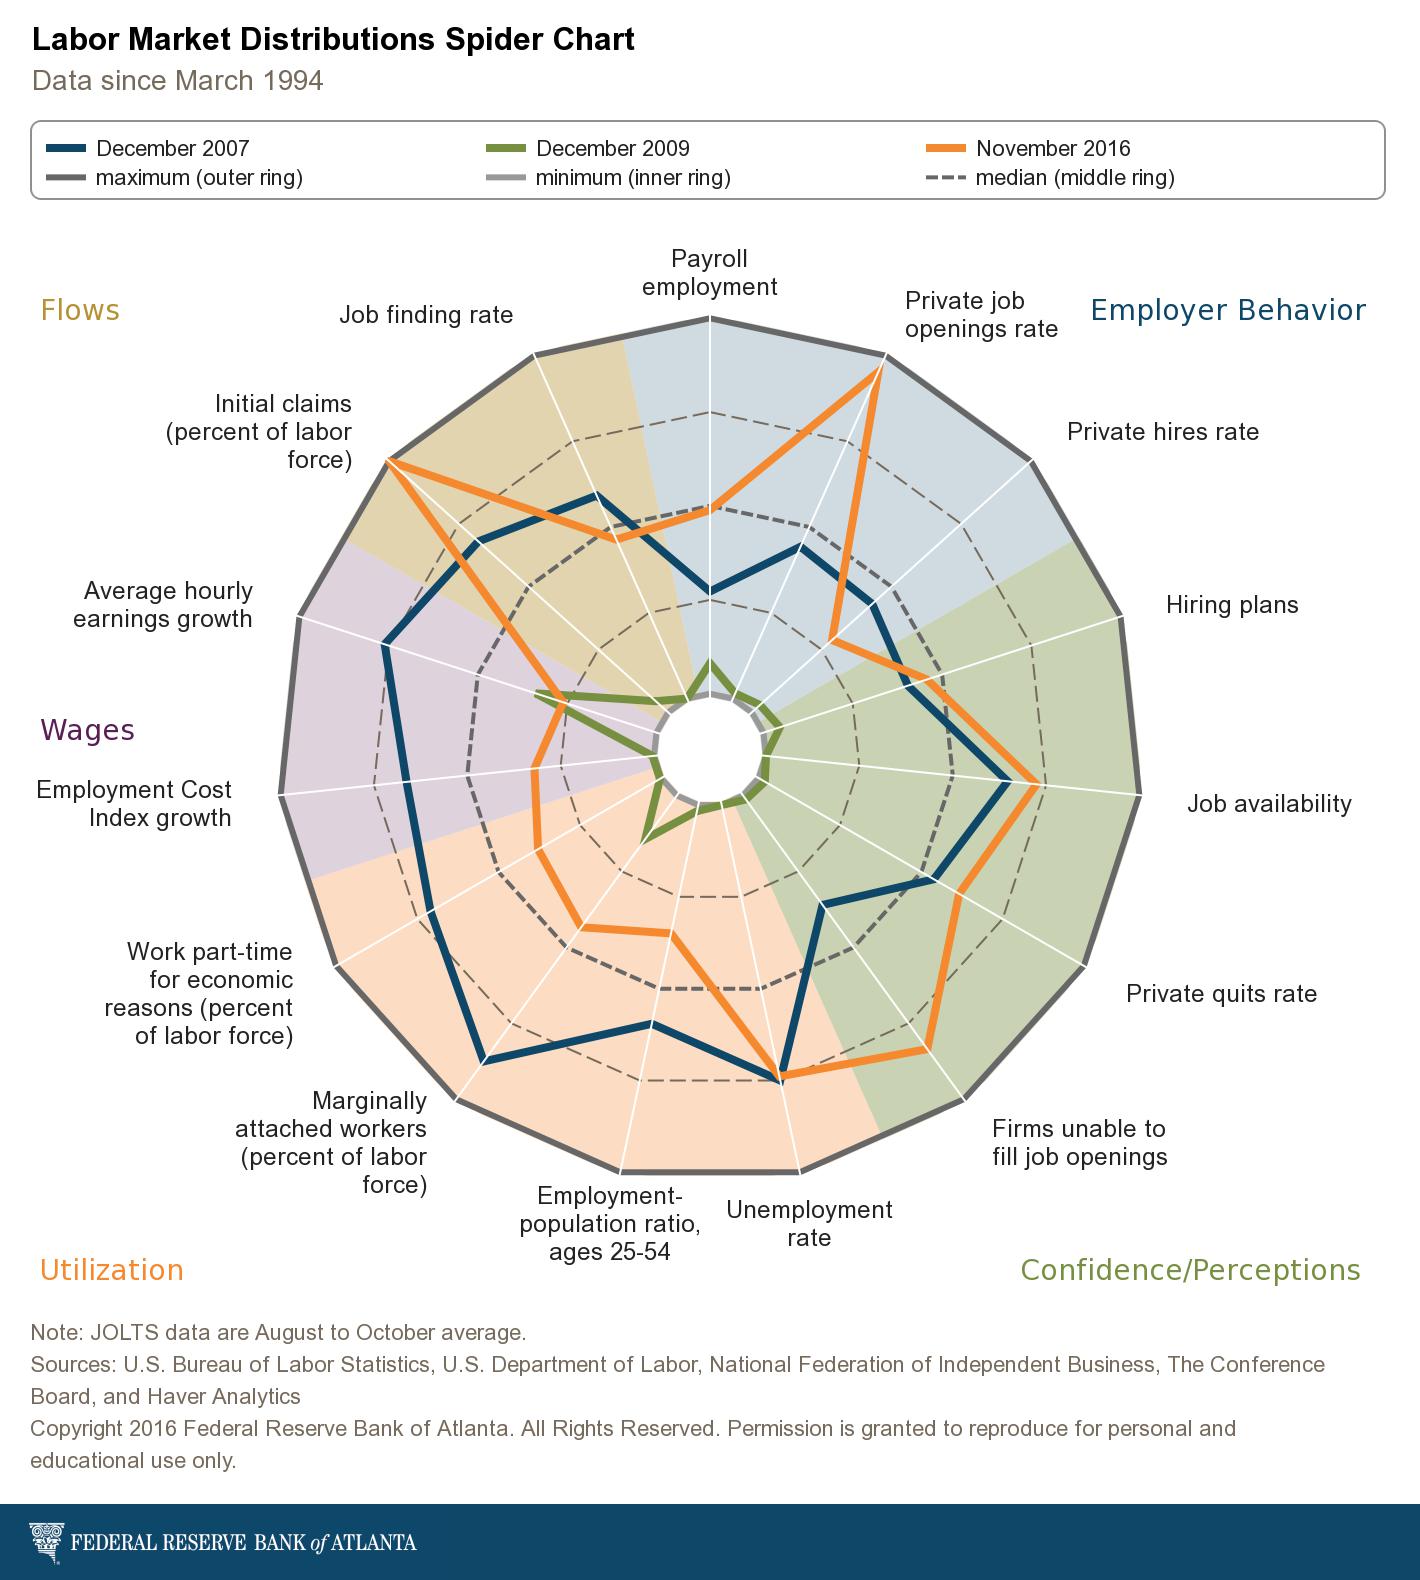
Employer behavior, overall confidence and some measure of job market flows are at or above the best levels of the preceding expansion. However, utilisation is still weak, which probably explains why wage growth has been weak:
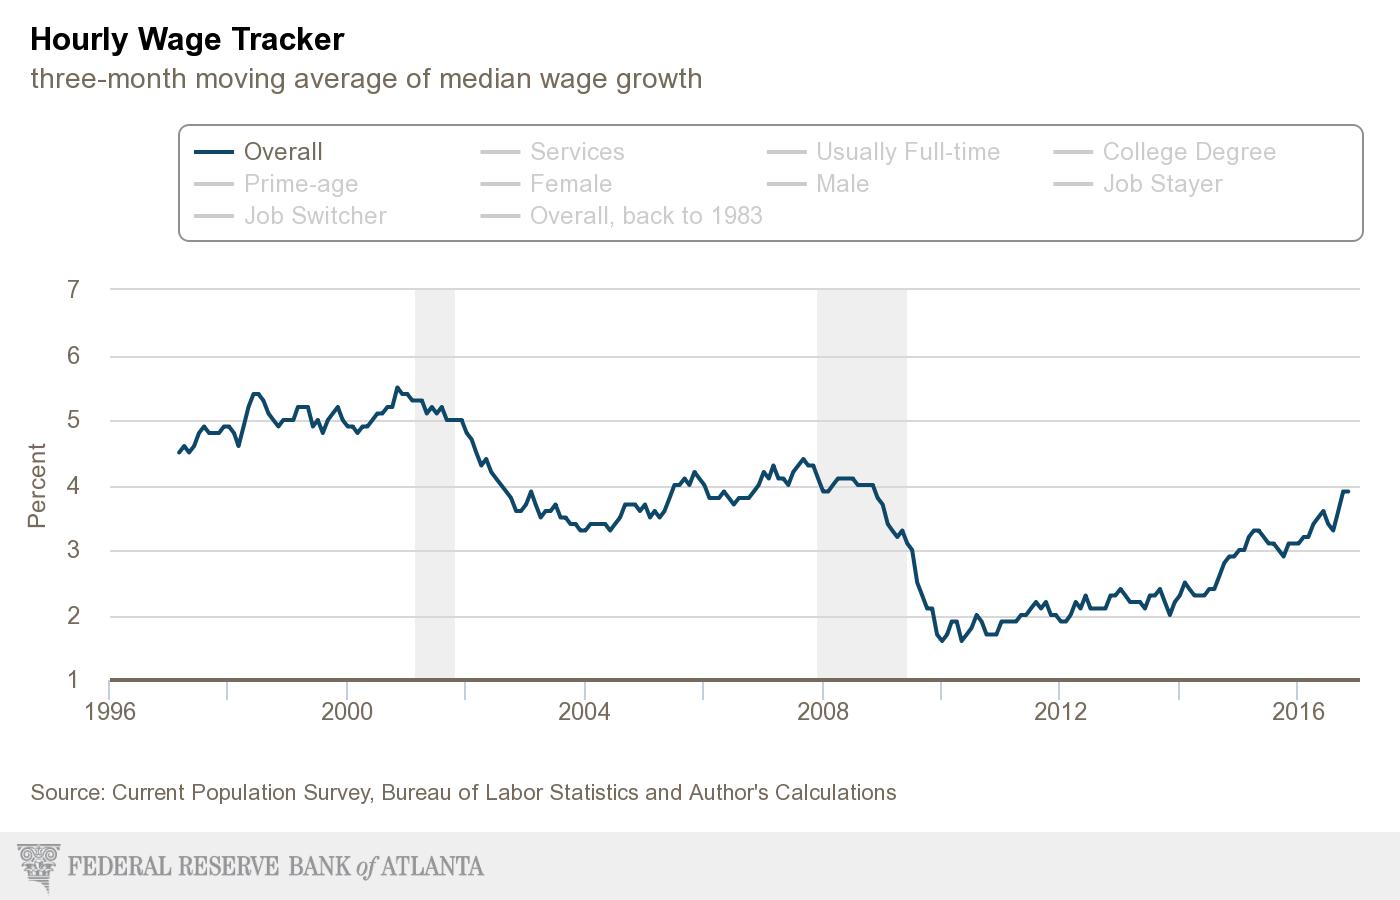
According to the Atlanta Fed’s wage tracker, the three-month average wage growth has only recently attained levels commensurate with the lowest rates of growth during the previous expansion.
And finally, we turn to prices:

Overall, prices are approaching the Fed’s 2% target. Core prices are 2.1%, while overall CPI, thanks to weak energy prices, remains below the 2%. But with oil prices rising, that should change soon.
Overall, the economy is doing well. Save for a few weak spots, growth is solid, unemployment is low and prices are contained. Let’s now look the long-leading, leading and coincident indicators, starting with the 4 long-leading numbers: corporate profits, M2 growth, building permits and lower-quality bond yields.
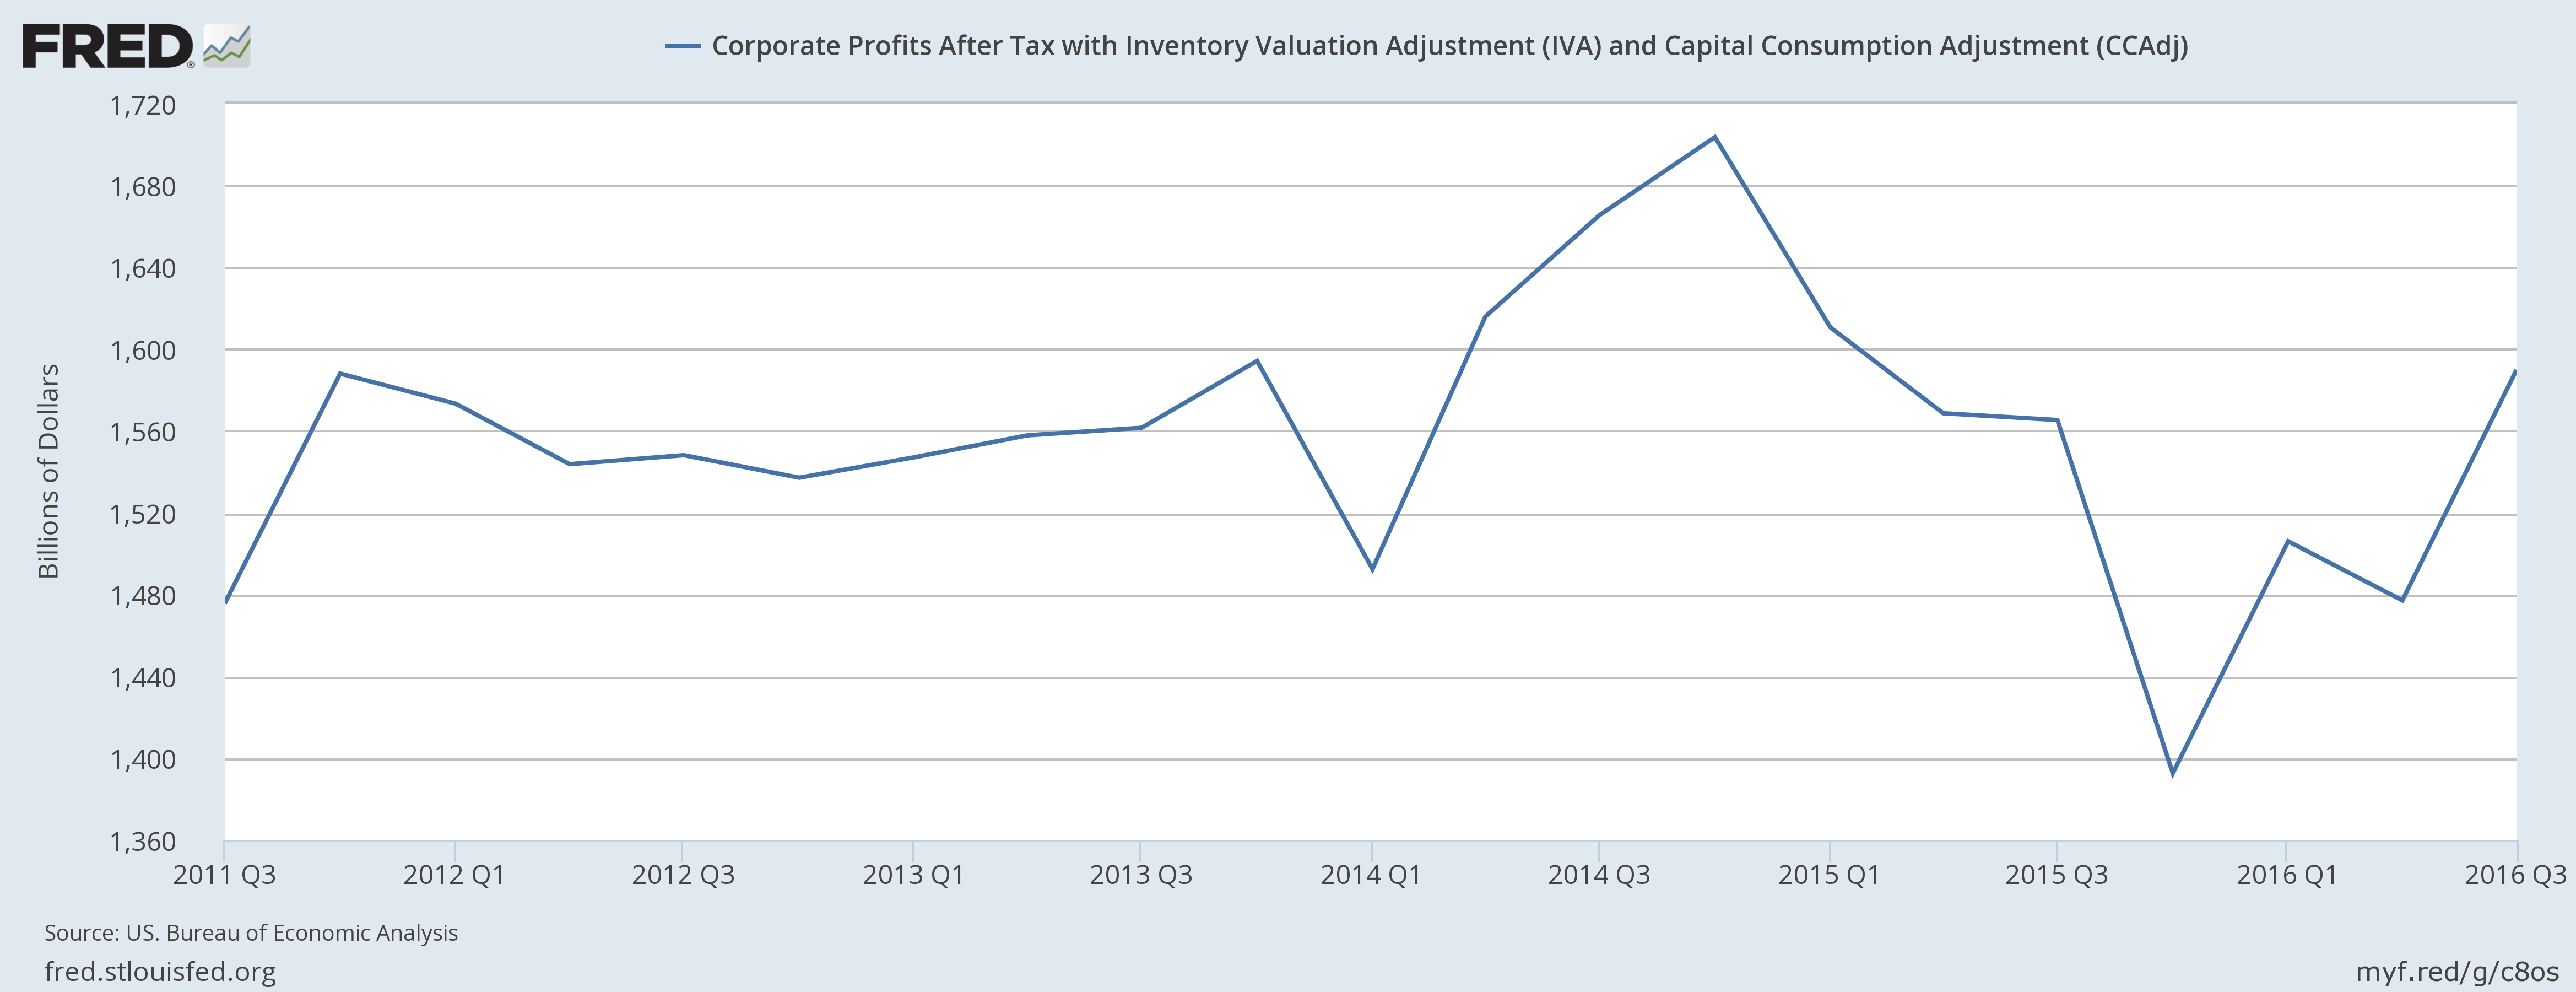
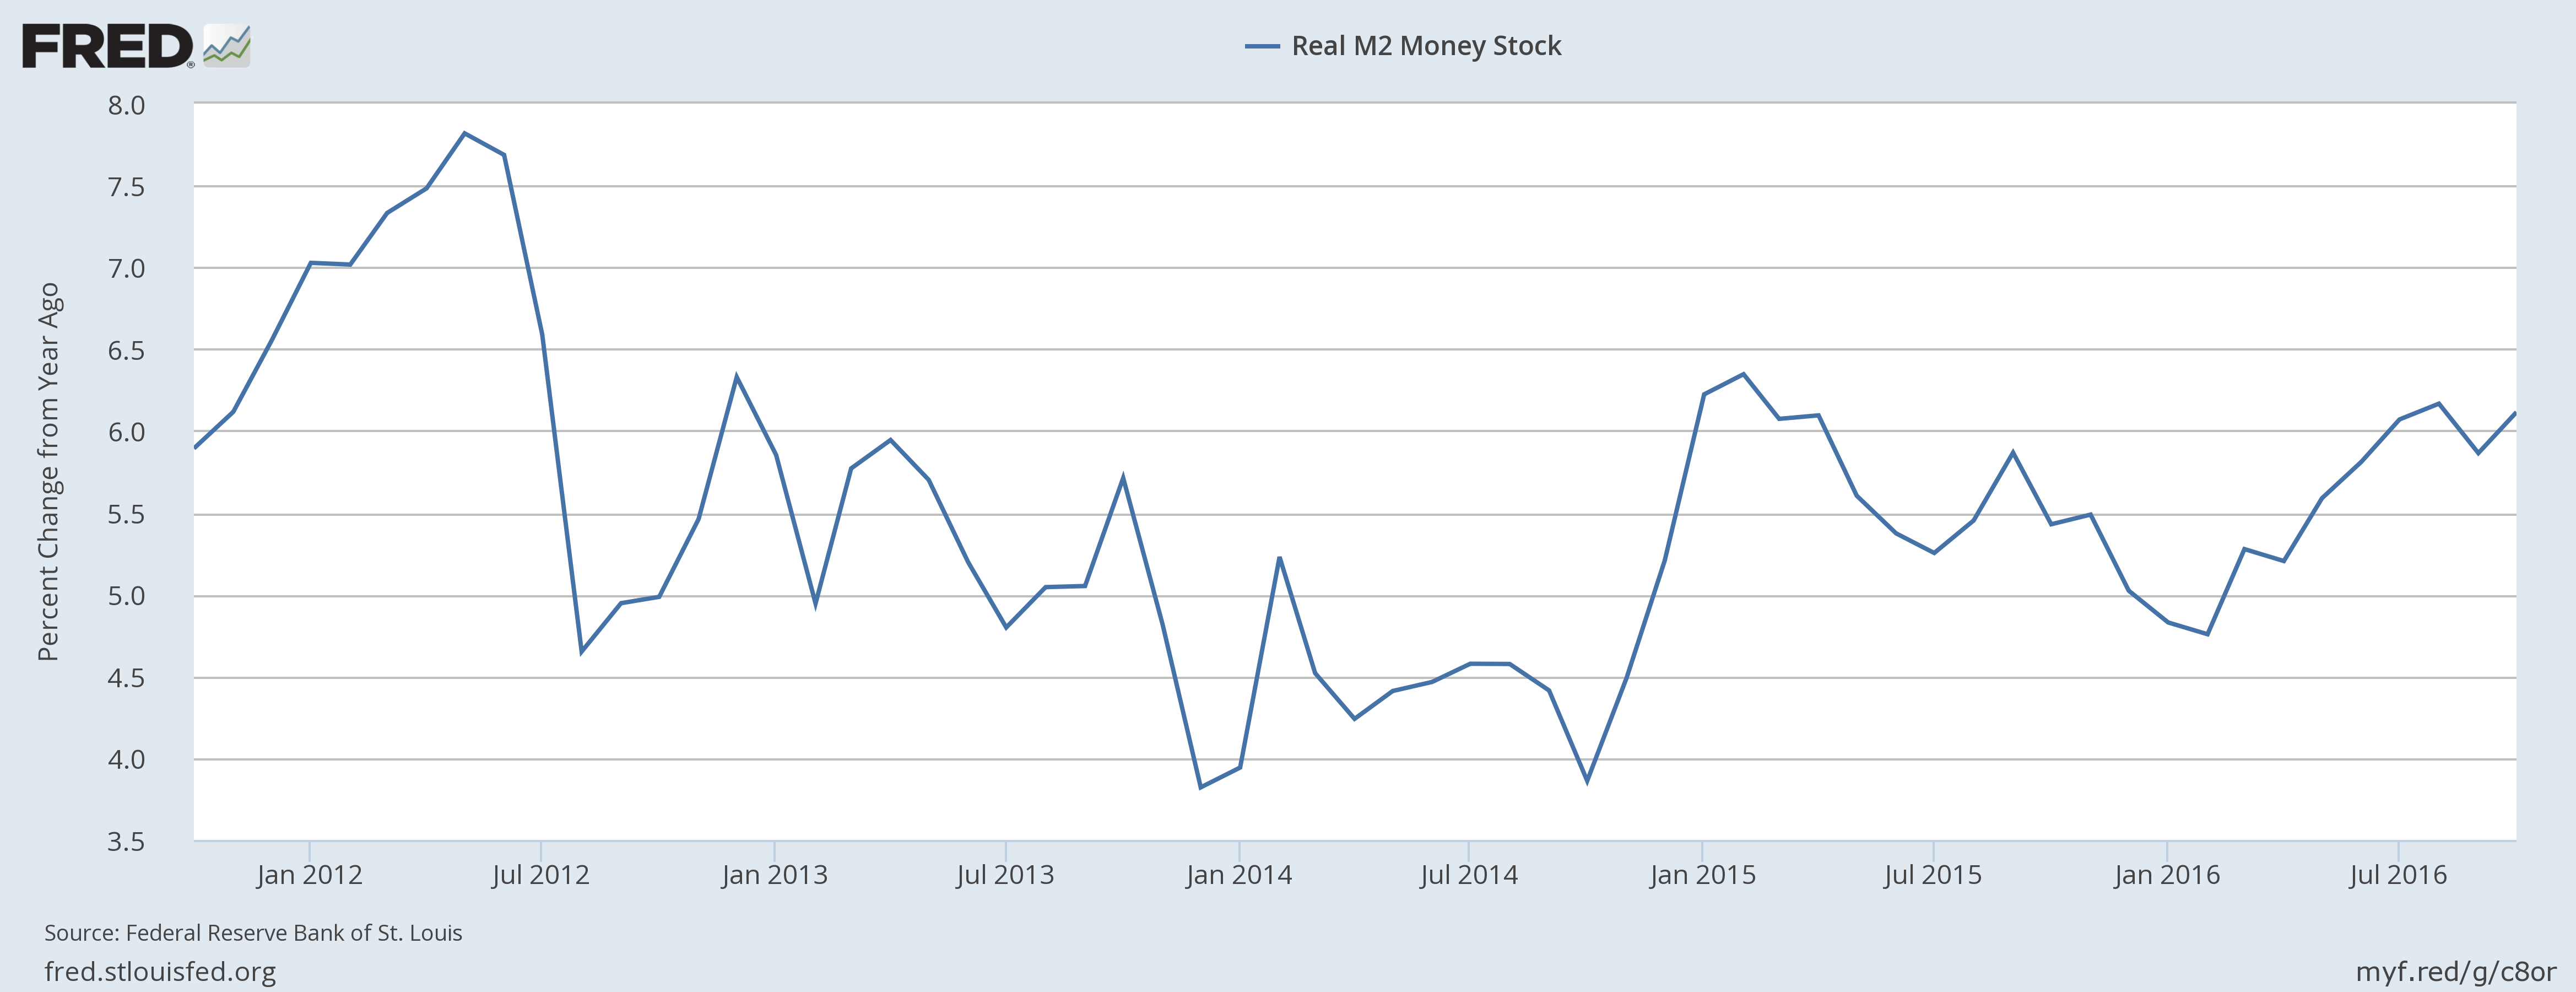
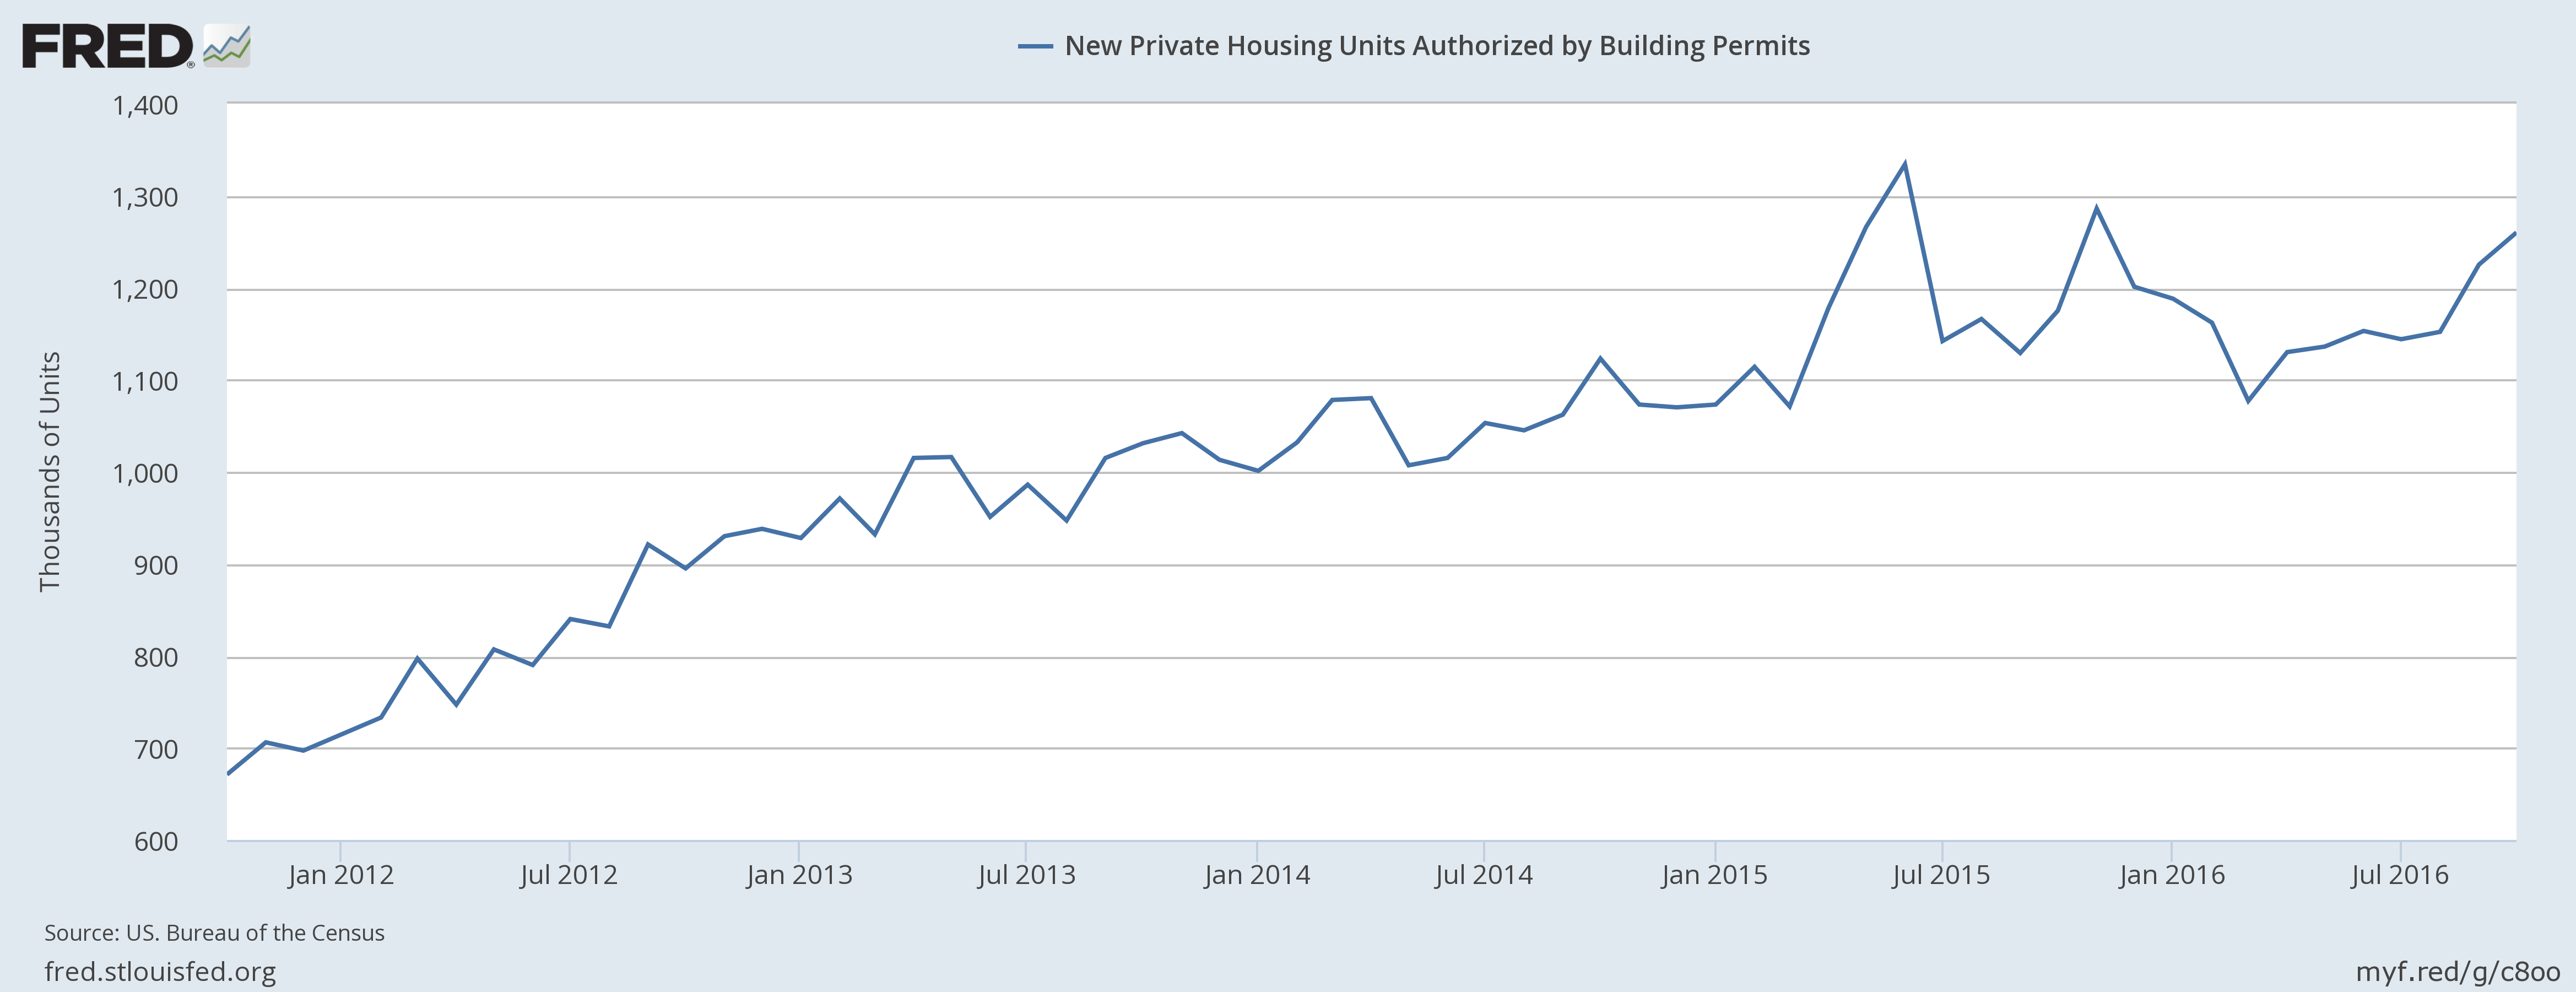
Corporate profits (top chart), Y/Y M2 growth (middle chart) and building permits (bottom chart) are neutral/positive. Ideally, a bullish signal would require them to be continually increasing. Instead, they’ve moved sideways for a somewhat extended period of time. A move lower would be undoubtedly bearish. A move sideways indicates the current activity level – which is positive – will probably continue.
Only mid-quality credits are giving mixed signals:
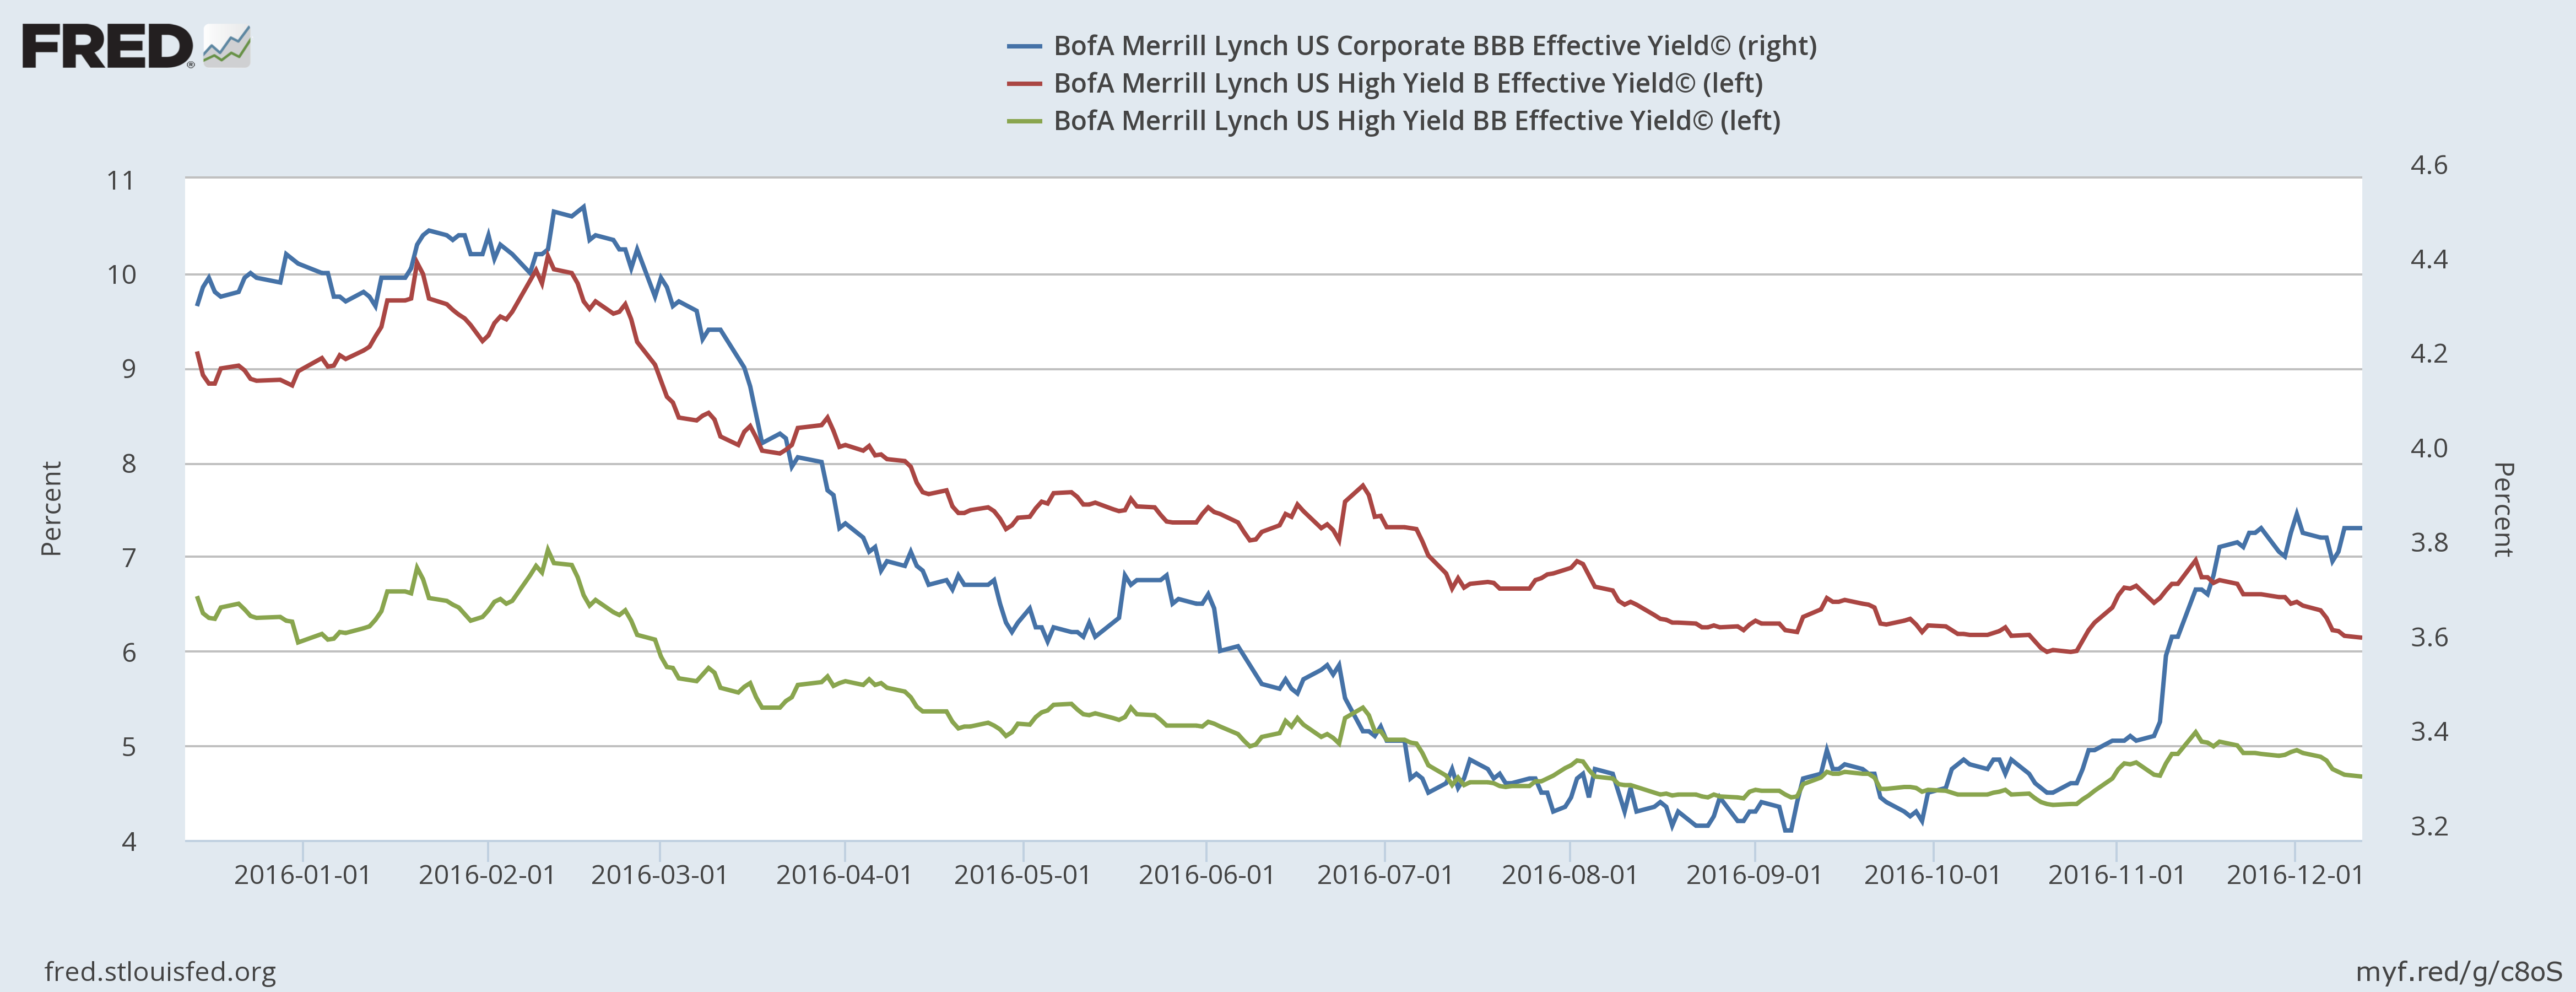
Lower quality credits (red and green, left scale) have moved lower, while the higher rated credits (in blue, right scale) have moved higher. This presents a cautionary set of data. But in light of the positive readings on the other three indicators, this is merely cautionary and not yet predictive.
The leading and coincidental indicators are also somewhat positive:
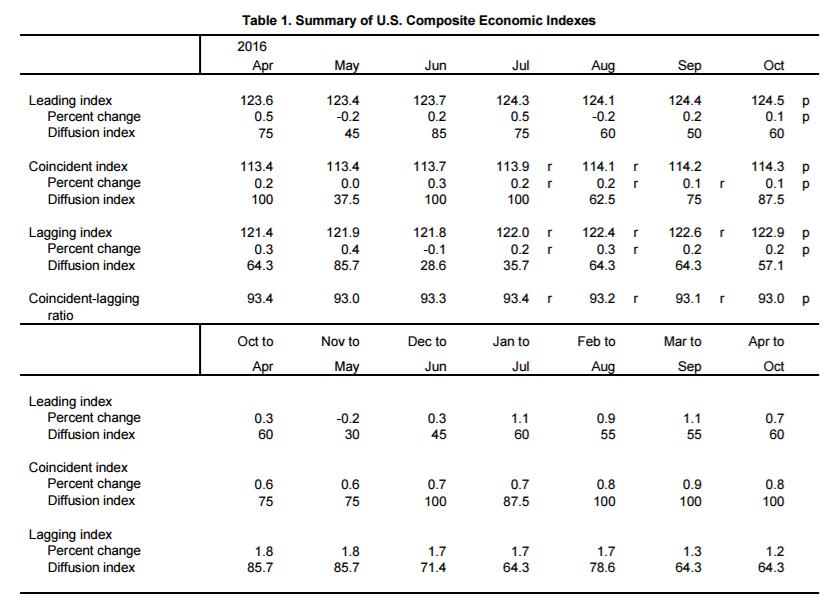
Month-to-month (top table), the LEIs and CEIs are both growing incrementally. The bottom table, which shows a 6-month rolling average of both, indicate moderate growth. This is in line with the Atlanta Fed’s 4Q GDPnowcast of 2.6% and the NY Fed’s prediction of 2.7%.
Overall, the economic news of the last 12-months has been positive while future growth also looks fairly solid. However, there are some potential clouds on the horizon, which I'll cover in the next article.
