Here is what I said about natural gas on 14th December.
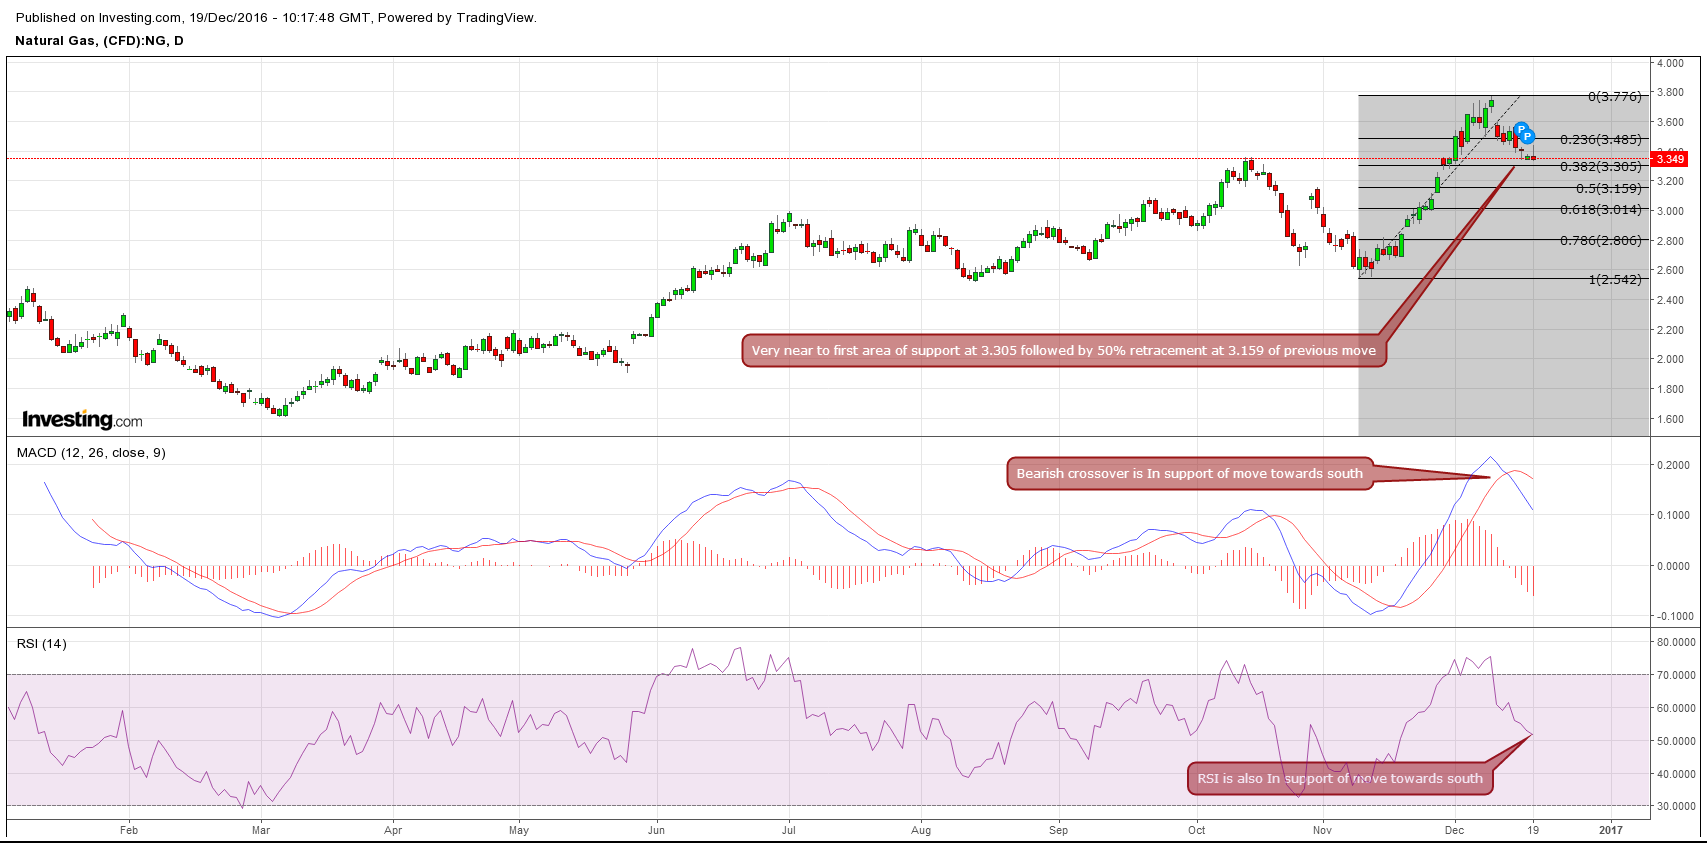
Here is the daily chart with latest update:
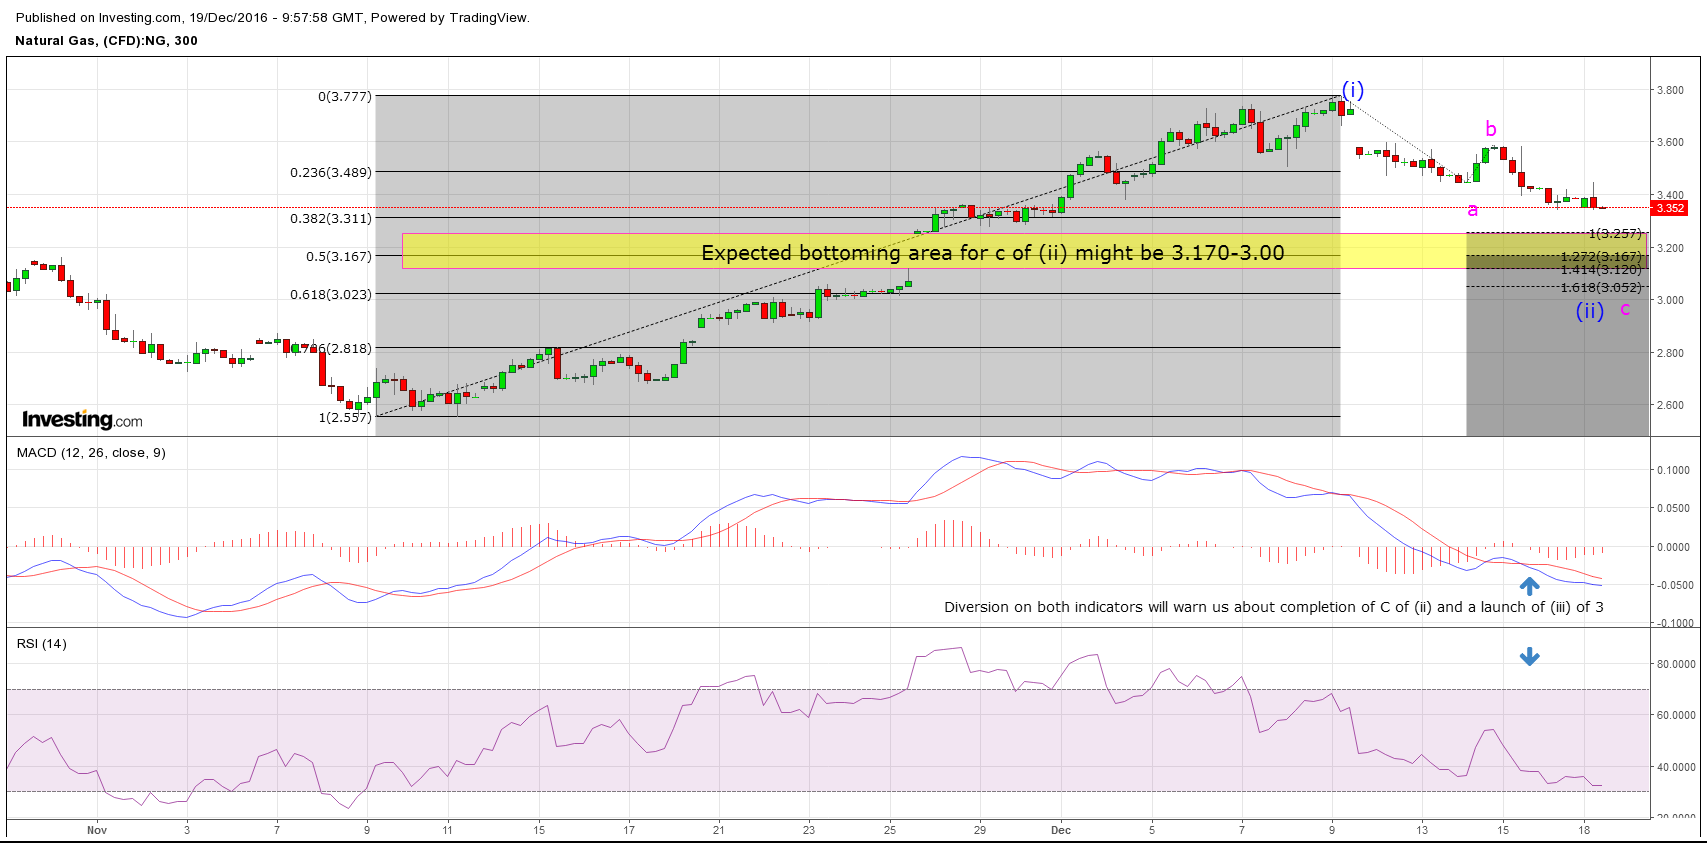
So far, it has hit the low of 3.330 as of writing. Now, it is reaching towards the support area of 3.300 followed by 3.17. Let's move on to the 5 hr chart for current progress.
So far no diversion on 5 hr chart (diversion most often hints that the completion of wave C is near) is supporting for move towards south before any sizeable bounce.
Resistance: 3.450 / 3.600 / 3.777
Support: 3.300 / 3.160 / 2.998
