📈 69% of S&P 500 stocks beating the index - a historic record! Pick the best ones with AI.See top stocks

Dillard’s Escalates 22% - Now in Resistance

Published 02/26/2019, 12:26 PM
Updated 07/09/2023, 06:31 AM

Summary:

  • Dillard’s (DDS) soared 22% on Tuesday morning, after the company posted earnings that beat Wall Street expectations.
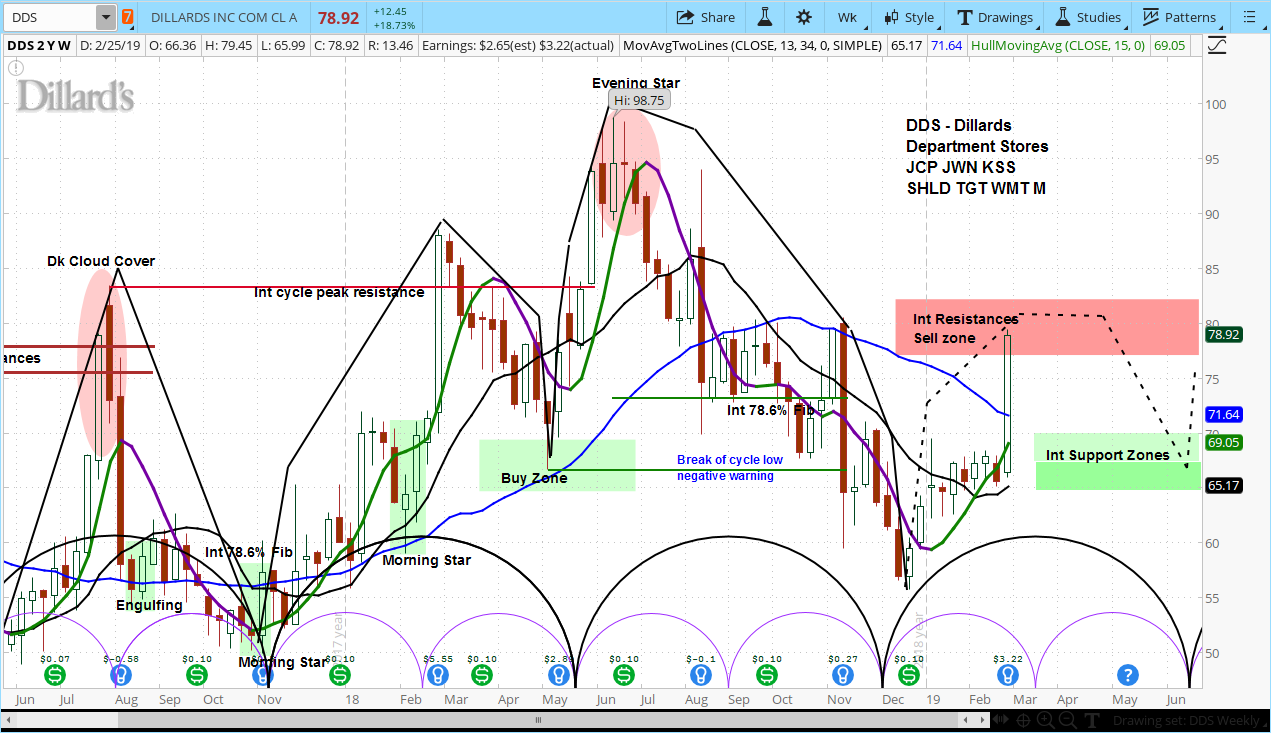
  • However, the stock is now in a resistance zone and we expect it to fail in the coming months.


Dillard’s (DDS) Stock Weekly Chart

The company reported earnings per share of $3.22 and total revenue of $2.06 billion, compared to analyst estimates of $2.66 and $2.03 billion. Same store sales increased by 2%, above the consensus of 0.5%.

CEO William Dillard explained that, “Our 2 percent comparable store sales increase for 2018 is comprised of four quarters of positive sales. We also held retail gross margin and operating expenses flat as a percent of sales.”

Nonetheless, we remain cautious, as this rally has taken DDS into a big resistance zone. While our review of the stock’s market cycles shows it is still in a rising phase, the close of this cycle is drawing near. We expect the rally to fail soon, falling back to near $70 by June.

For more from Slim, or to learn about cycle analysis, check out the askSlim Market Week show every Friday on our YouTube channel.

Latest comments

Loading next article…
Risk Disclosure: Trading in financial instruments and/or cryptocurrencies involves high risks including the risk of losing some, or all, of your investment amount, and may not be suitable for all investors. Prices of cryptocurrencies are extremely volatile and may be affected by external factors such as financial, regulatory or political events. Trading on margin increases the financial risks.
Before deciding to trade in financial instrument or cryptocurrencies you should be fully informed of the risks and costs associated with trading the financial markets, carefully consider your investment objectives, level of experience, and risk appetite, and seek professional advice where needed.
Fusion Media would like to remind you that the data contained in this website is not necessarily real-time nor accurate. The data and prices on the website are not necessarily provided by any market or exchange, but may be provided by market makers, and so prices may not be accurate and may differ from the actual price at any given market, meaning prices are indicative and not appropriate for trading purposes. Fusion Media and any provider of the data contained in this website will not accept liability for any loss or damage as a result of your trading, or your reliance on the information contained within this website.
It is prohibited to use, store, reproduce, display, modify, transmit or distribute the data contained in this website without the explicit prior written permission of Fusion Media and/or the data provider. All intellectual property rights are reserved by the providers and/or the exchange providing the data contained in this website.
Fusion Media may be compensated by the advertisers that appear on the website, based on your interaction with the advertisements or advertisers.
© 2007-2024 - Fusion Media Limited. All Rights Reserved.